| __timestamp | 3M Company | W.W. Grainger, Inc. |
|---|---|---|
| Wednesday, January 1, 2014 | 6469000000 | 2967125000 |
| Thursday, January 1, 2015 | 6182000000 | 2931108000 |
| Friday, January 1, 2016 | 6111000000 | 2995060000 |
| Sunday, January 1, 2017 | 6572000000 | 3048895000 |
| Monday, January 1, 2018 | 7602000000 | 3190000000 |
| Tuesday, January 1, 2019 | 7029000000 | 3135000000 |
| Wednesday, January 1, 2020 | 6929000000 | 3219000000 |
| Friday, January 1, 2021 | 7197000000 | 3173000000 |
| Saturday, January 1, 2022 | 9049000000 | 3634000000 |
| Sunday, January 1, 2023 | 21526000000 | 3931000000 |
| Monday, January 1, 2024 | 4221000000 | 4121000000 |
In pursuit of knowledge
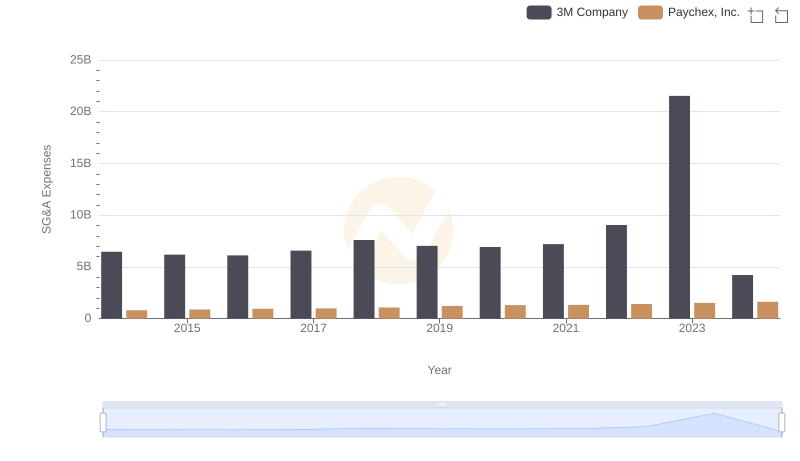
In the ever-evolving landscape of industrial giants, 3M Company and W.W. Grainger, Inc. have showcased intriguing trends in their Selling, General, and Administrative (SG&A) expenses over the past decade. From 2014 to 2023, 3M's SG&A expenses have seen a dramatic increase, peaking in 2023 with a staggering 215% rise compared to 2014. This surge reflects strategic investments and perhaps increased operational costs. In contrast, W.W. Grainger, Inc. has maintained a more stable trajectory, with expenses growing by approximately 32% over the same period. This stability might indicate efficient cost management or a more conservative growth strategy. Notably, 2024 data for W.W. Grainger, Inc. is missing, leaving room for speculation on future trends. As these companies navigate the complexities of the global market, their SG&A expenses offer a window into their strategic priorities and operational efficiencies.
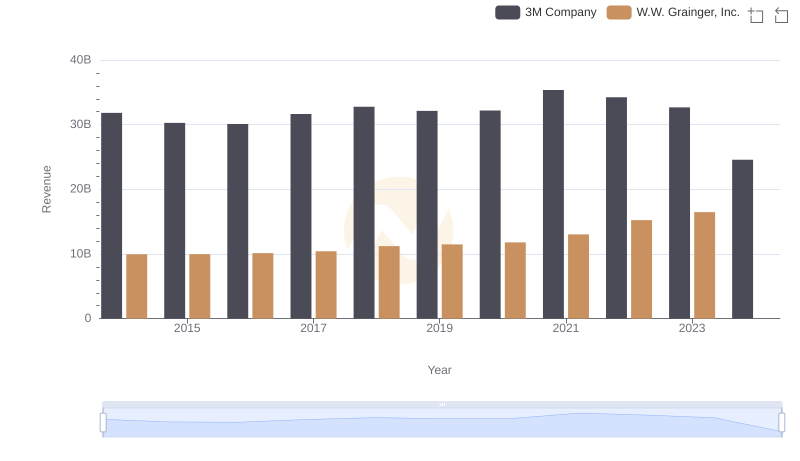
3M Company vs W.W. Grainger, Inc.: Examining Key Revenue Metrics
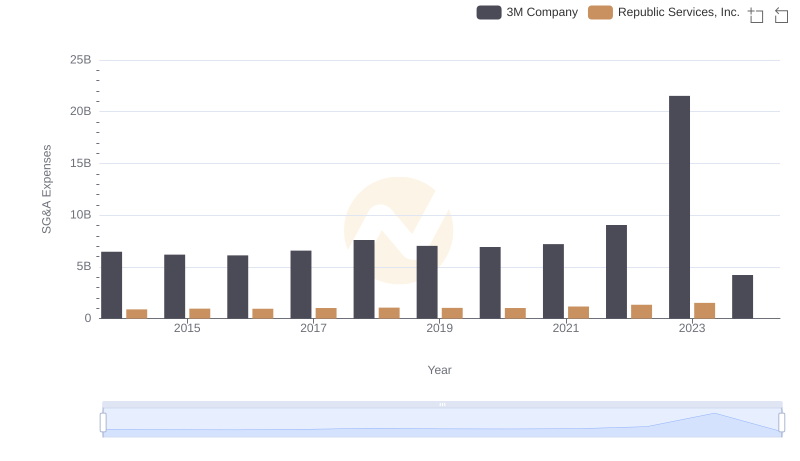
Comparing SG&A Expenses: 3M Company vs Republic Services, Inc. Trends and Insights
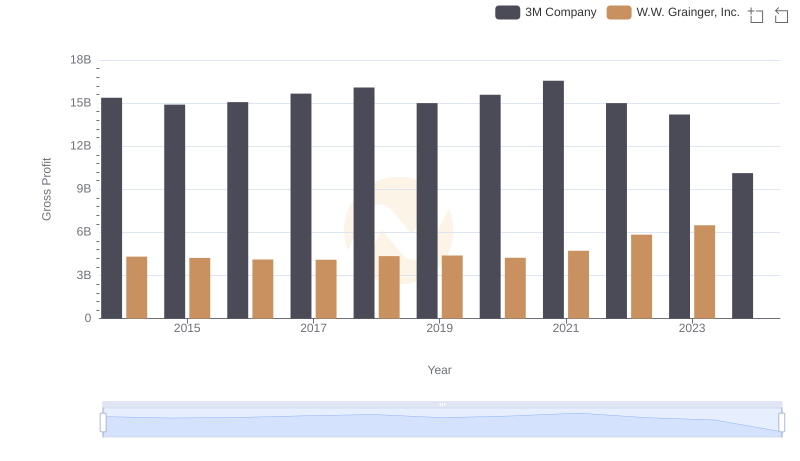
Gross Profit Trends Compared: 3M Company vs W.W. Grainger, Inc.
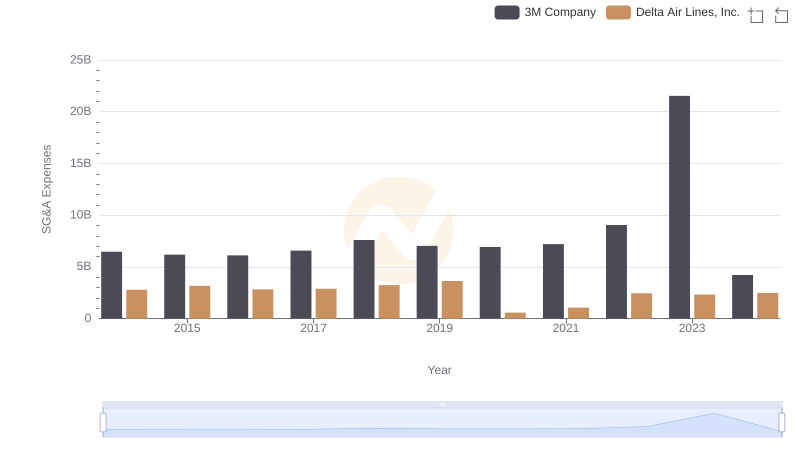
Selling, General, and Administrative Costs: 3M Company vs Delta Air Lines, Inc.
3M Company and Paychex, Inc.: SG&A Spending Patterns Compared

3M Company and PACCAR Inc: SG&A Spending Patterns Compared