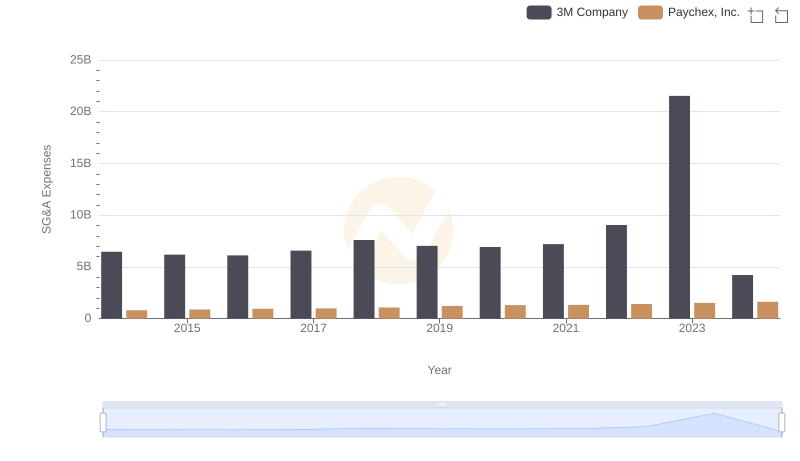
| __timestamp | 3M Company | PACCAR Inc |
|---|---|---|
| Wednesday, January 1, 2014 | 6469000000 | 561400000 |
| Thursday, January 1, 2015 | 6182000000 | 541500000 |
| Friday, January 1, 2016 | 6111000000 | 540200000 |
| Sunday, January 1, 2017 | 6572000000 | 555000000 |
| Monday, January 1, 2018 | 7602000000 | 644700000 |
| Tuesday, January 1, 2019 | 7029000000 | 698500000 |
| Wednesday, January 1, 2020 | 6929000000 | 581400000 |
| Friday, January 1, 2021 | 7197000000 | 676800000 |
| Saturday, January 1, 2022 | 9049000000 | 726300000 |
| Sunday, January 1, 2023 | 21526000000 | 784600000 |
| Monday, January 1, 2024 | 4221000000 | 585000000 |
Unveiling the hidden dimensions of data
In the world of industrial giants, 3M Company and PACCAR Inc. have long been stalwarts, each with its own unique approach to managing Selling, General, and Administrative (SG&A) expenses. Over the past decade, 3M's SG&A expenses have shown a remarkable increase, peaking in 2023 with a staggering 166% rise compared to 2014. This surge reflects strategic investments and perhaps a response to evolving market demands. In contrast, PACCAR Inc. has maintained a more stable trajectory, with its SG&A expenses growing by approximately 40% over the same period. This stability suggests a consistent operational strategy, focusing on efficiency and cost management. The data from 2014 to 2024 highlights the contrasting financial strategies of these two industry leaders, offering insights into their corporate philosophies and market positioning. As we look to the future, these patterns may provide clues to their ongoing competitive strategies.
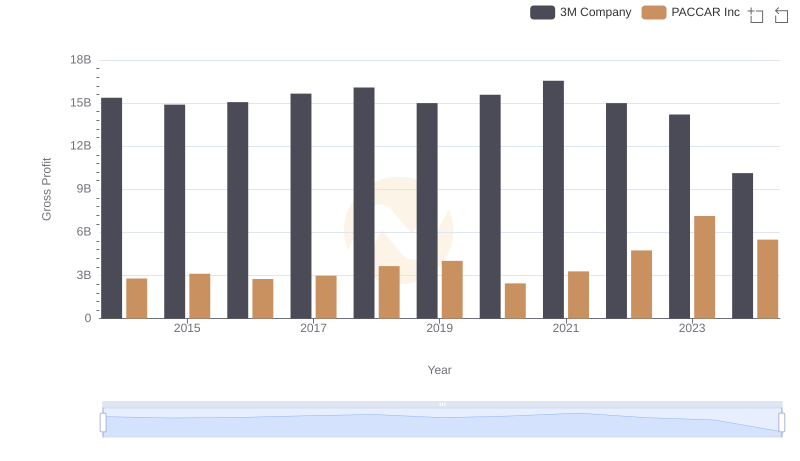
3M Company and PACCAR Inc: A Detailed Gross Profit Analysis
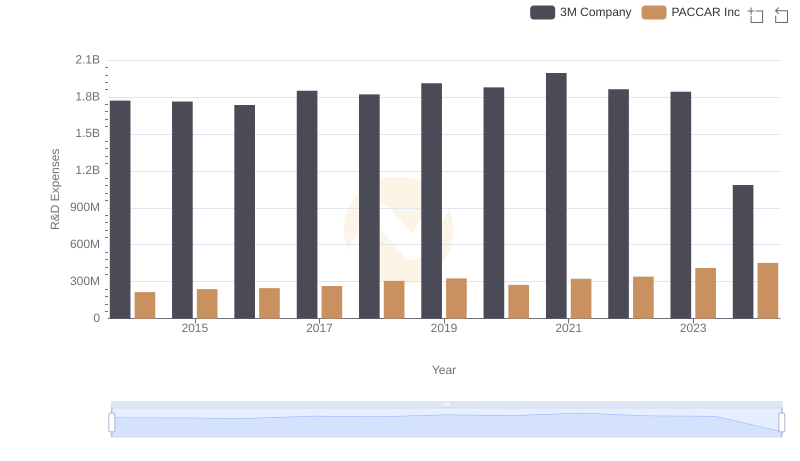
Analyzing R&D Budgets: 3M Company vs PACCAR Inc
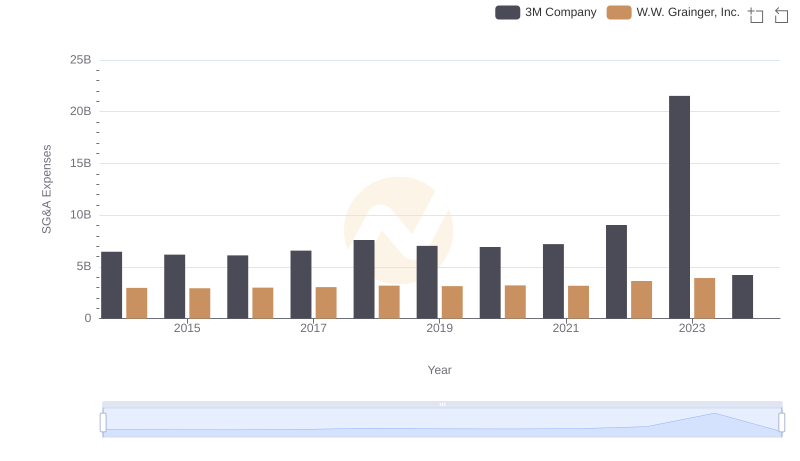
3M Company vs W.W. Grainger, Inc.: SG&A Expense Trends
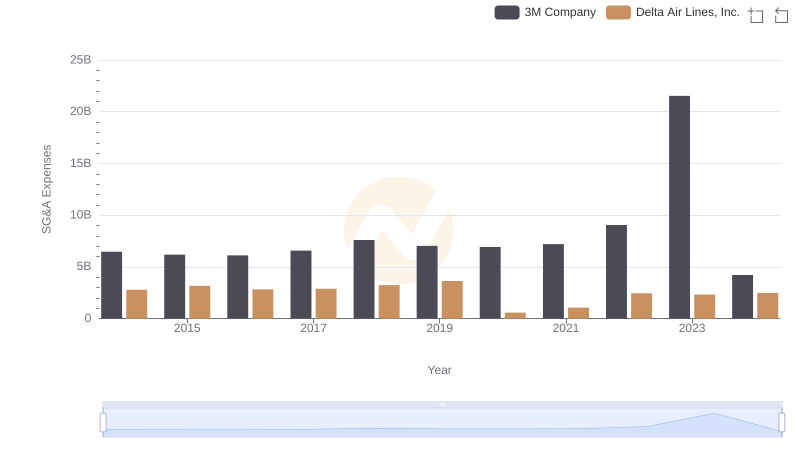
Selling, General, and Administrative Costs: 3M Company vs Delta Air Lines, Inc.
3M Company and Paychex, Inc.: SG&A Spending Patterns Compared