| __timestamp | 3M Company | Republic Services, Inc. |
|---|---|---|
| Wednesday, January 1, 2014 | 6469000000 | 896300000 |
| Thursday, January 1, 2015 | 6182000000 | 960400000 |
| Friday, January 1, 2016 | 6111000000 | 949400000 |
| Sunday, January 1, 2017 | 6572000000 | 1026800000 |
| Monday, January 1, 2018 | 7602000000 | 1059500000 |
| Tuesday, January 1, 2019 | 7029000000 | 1042000000 |
| Wednesday, January 1, 2020 | 6929000000 | 1025200000 |
| Friday, January 1, 2021 | 7197000000 | 1175900000 |
| Saturday, January 1, 2022 | 9049000000 | 1335800000 |
| Sunday, January 1, 2023 | 21526000000 | 1522000000 |
| Monday, January 1, 2024 | 4221000000 | 1647000000 |
Infusing magic into the data realm
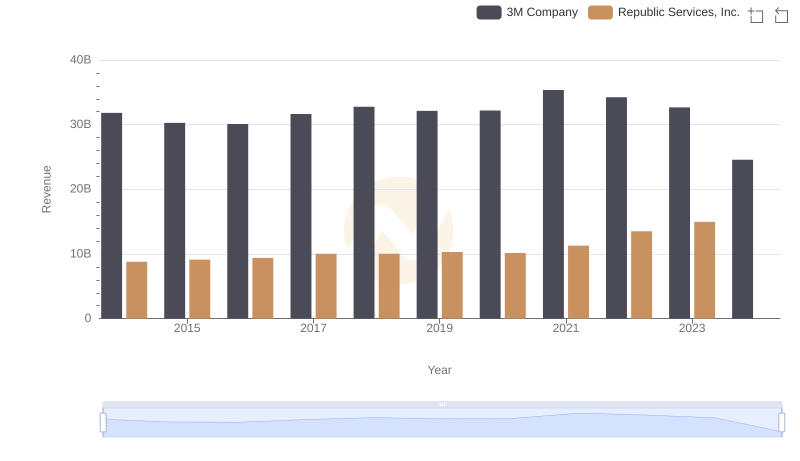
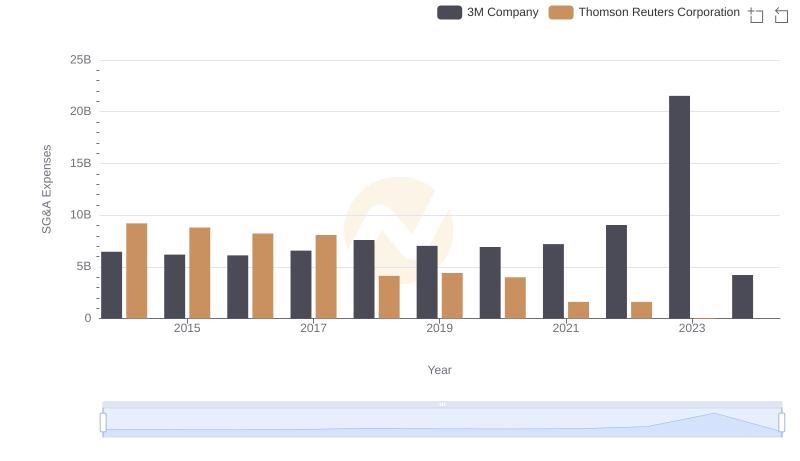
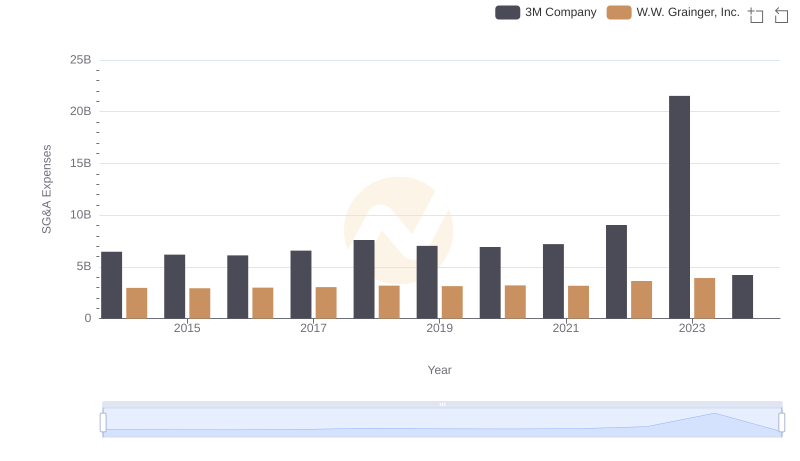
In the ever-evolving landscape of corporate finance, understanding the trends in Selling, General, and Administrative (SG&A) expenses offers a window into a company's operational efficiency. Over the past decade, 3M Company and Republic Services, Inc. have showcased contrasting trajectories in their SG&A expenditures.
From 2014 to 2023, 3M's SG&A expenses have seen a dramatic increase, peaking in 2023 with a staggering 165% rise compared to 2014. This surge reflects strategic investments and perhaps challenges in cost management. In contrast, Republic Services, Inc. has maintained a more stable SG&A profile, with a modest 70% increase over the same period, indicating a consistent approach to managing operational costs.
The data reveals a fascinating narrative of growth and stability, offering insights into how these industry leaders navigate financial strategies in a competitive market.