| __timestamp | 3M Company | W.W. Grainger, Inc. |
|---|---|---|
| Wednesday, January 1, 2014 | 31821000000 | 9964953000 |
| Thursday, January 1, 2015 | 30274000000 | 9973384000 |
| Friday, January 1, 2016 | 30109000000 | 10137204000 |
| Sunday, January 1, 2017 | 31657000000 | 10424858000 |
| Monday, January 1, 2018 | 32765000000 | 11221000000 |
| Tuesday, January 1, 2019 | 32136000000 | 11486000000 |
| Wednesday, January 1, 2020 | 32184000000 | 11797000000 |
| Friday, January 1, 2021 | 35355000000 | 13022000000 |
| Saturday, January 1, 2022 | 34229000000 | 15228000000 |
| Sunday, January 1, 2023 | 32681000000 | 16478000000 |
| Monday, January 1, 2024 | 24575000000 | 17168000000 |
In pursuit of knowledge
In the competitive landscape of industrial supply and manufacturing, 3M Company and W.W. Grainger, Inc. have long been titans. From 2014 to 2023, these companies have shown distinct revenue trajectories. 3M Company, a stalwart in innovation, saw its revenue peak in 2021, with a notable 11% increase from 2020. However, by 2024, their revenue experienced a significant drop, indicating potential market challenges or strategic shifts.
Conversely, W.W. Grainger, Inc., a leader in maintenance, repair, and operations supplies, demonstrated a steady upward trend. From 2014 to 2023, their revenue grew by approximately 65%, showcasing resilience and adaptability in a dynamic market. The absence of 2024 data for Grainger suggests a need for further analysis to understand their current standing.
This comparison highlights the evolving dynamics in the industrial sector, where adaptability and innovation are key to sustained growth.
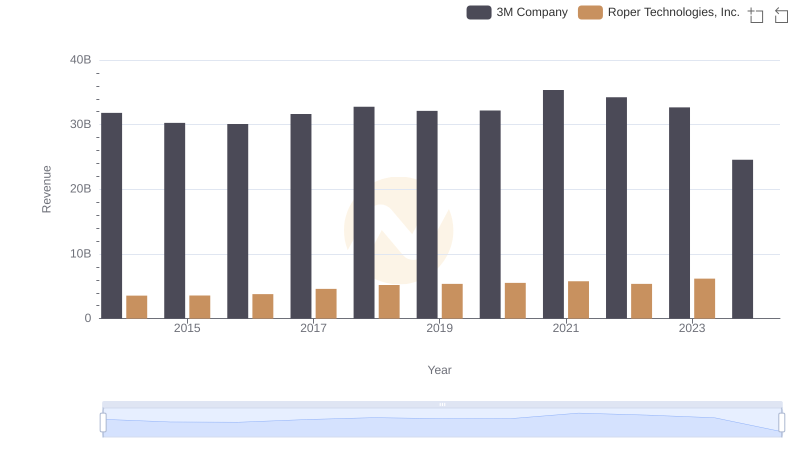
Comparing Revenue Performance: 3M Company or Roper Technologies, Inc.?
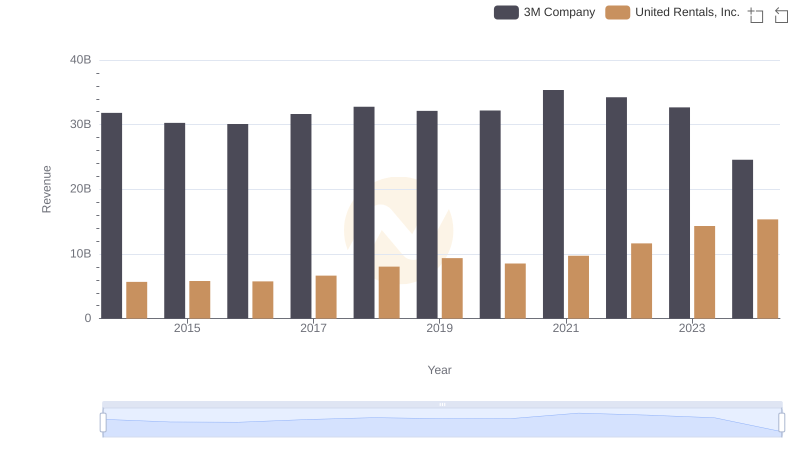
Who Generates More Revenue? 3M Company or United Rentals, Inc.
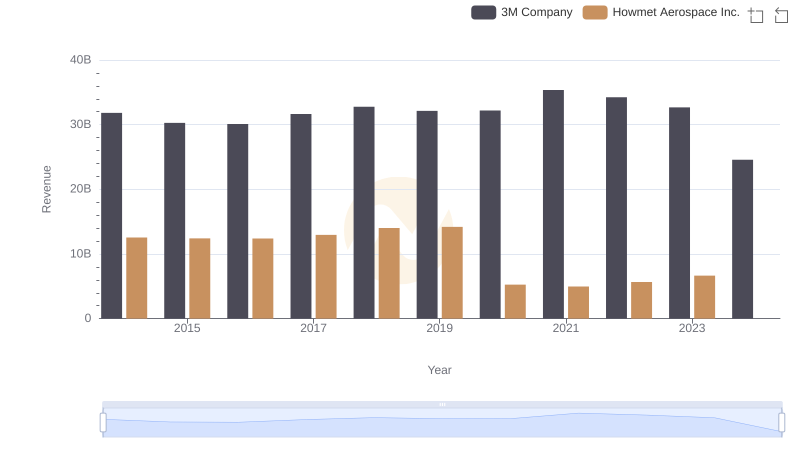
Annual Revenue Comparison: 3M Company vs Howmet Aerospace Inc.
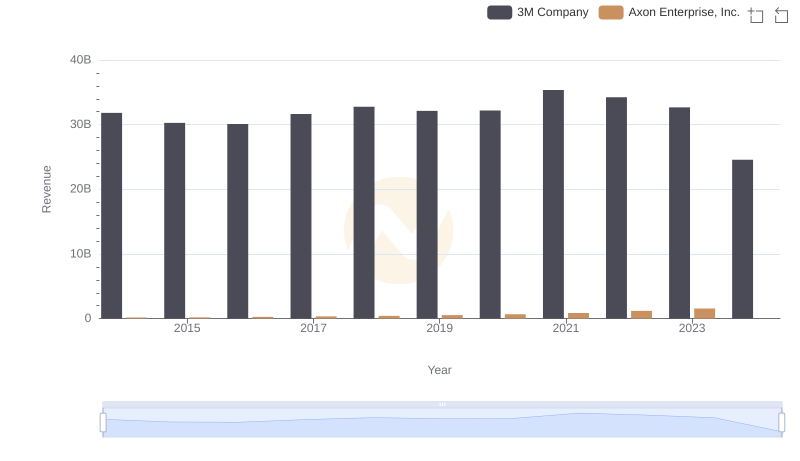
Revenue Showdown: 3M Company vs Axon Enterprise, Inc.
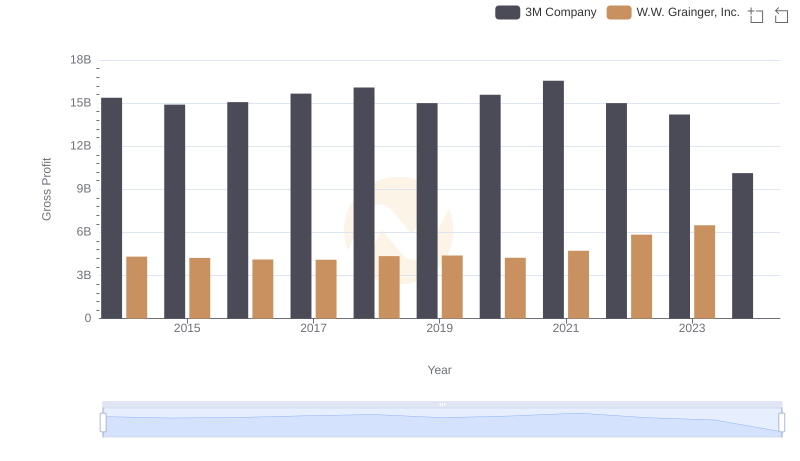
Gross Profit Trends Compared: 3M Company vs W.W. Grainger, Inc.
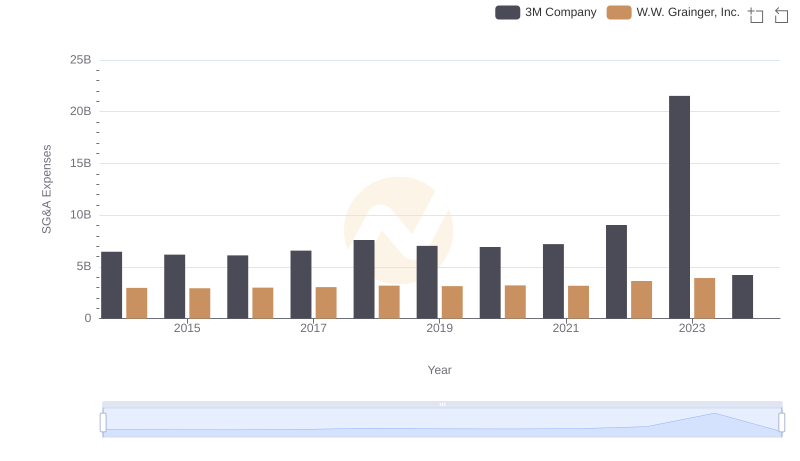
3M Company vs W.W. Grainger, Inc.: SG&A Expense Trends