| __timestamp | 3M Company | Paychex, Inc. |
|---|---|---|
| Wednesday, January 1, 2014 | 6469000000 | 803700000 |
| Thursday, January 1, 2015 | 6182000000 | 878000000 |
| Friday, January 1, 2016 | 6111000000 | 948200000 |
| Sunday, January 1, 2017 | 6572000000 | 992100000 |
| Monday, January 1, 2018 | 7602000000 | 1075600000 |
| Tuesday, January 1, 2019 | 7029000000 | 1223400000 |
| Wednesday, January 1, 2020 | 6929000000 | 1299200000 |
| Friday, January 1, 2021 | 7197000000 | 1324900000 |
| Saturday, January 1, 2022 | 9049000000 | 1415400000 |
| Sunday, January 1, 2023 | 21526000000 | 1521000000 |
| Monday, January 1, 2024 | 4221000000 | 1624900000 |
Unveiling the hidden dimensions of data
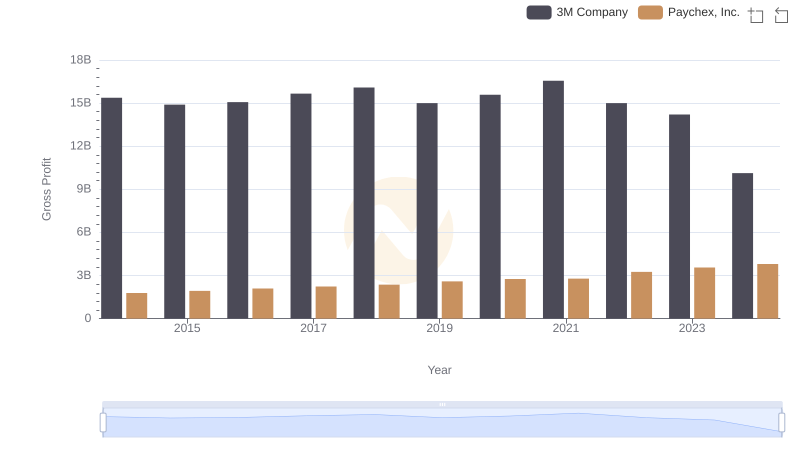
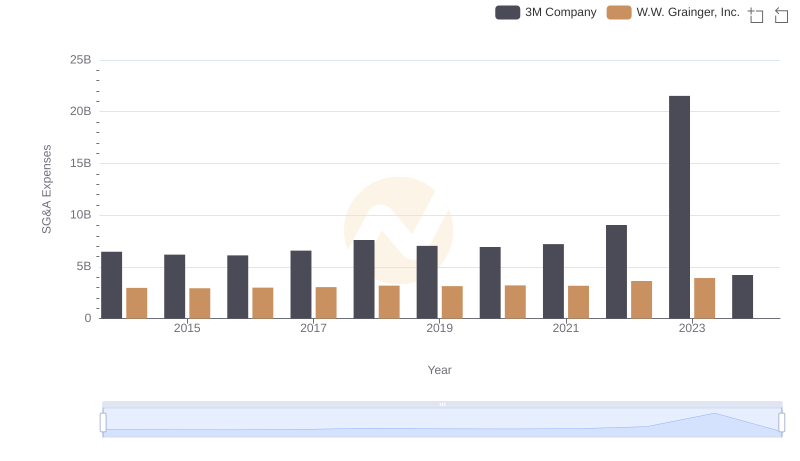
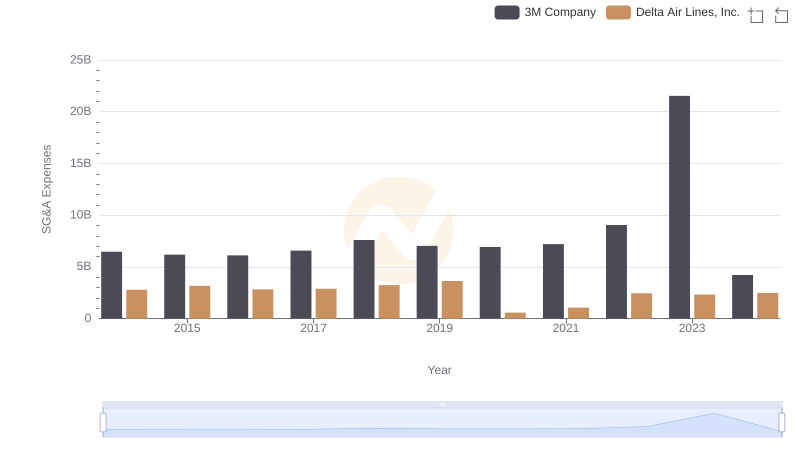
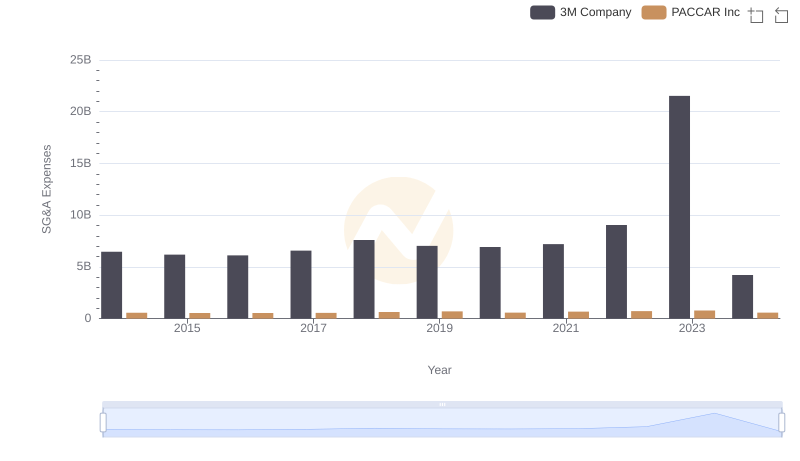
In the world of corporate finance, understanding a company's spending patterns can reveal much about its strategic priorities. Over the past decade, 3M Company and Paychex, Inc. have demonstrated contrasting approaches to their Selling, General, and Administrative (SG&A) expenses.
From 2014 to 2023, 3M's SG&A expenses have shown significant fluctuations, peaking in 2023 with a staggering 166% increase compared to 2014. This suggests a strategic shift or response to market conditions. In contrast, Paychex, Inc. has maintained a more consistent growth trajectory, with a steady increase of approximately 102% over the same period.
These patterns highlight the differing operational strategies of these two giants. While 3M appears to be navigating through a volatile spending landscape, Paychex's steady rise suggests a more controlled and predictable approach. Understanding these trends can provide valuable insights for investors and analysts alike.