| __timestamp | 3M Company | Delta Air Lines, Inc. |
|---|---|---|
| Wednesday, January 1, 2014 | 6469000000 | 2785000000 |
| Thursday, January 1, 2015 | 6182000000 | 3162000000 |
| Friday, January 1, 2016 | 6111000000 | 2825000000 |
| Sunday, January 1, 2017 | 6572000000 | 2892000000 |
| Monday, January 1, 2018 | 7602000000 | 3242000000 |
| Tuesday, January 1, 2019 | 7029000000 | 3636000000 |
| Wednesday, January 1, 2020 | 6929000000 | 582000000 |
| Friday, January 1, 2021 | 7197000000 | 1061000000 |
| Saturday, January 1, 2022 | 9049000000 | 2454000000 |
| Sunday, January 1, 2023 | 21526000000 | 2334000000 |
| Monday, January 1, 2024 | 4221000000 | 2485000000 |
Unlocking the unknown
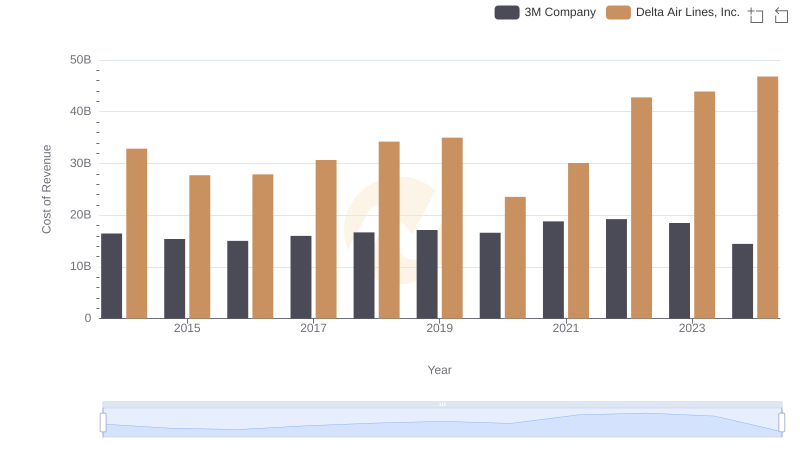
In the ever-evolving landscape of corporate America, understanding the financial dynamics of industry leaders is crucial. This chart offers a fascinating glimpse into the Selling, General, and Administrative (SG&A) expenses of two iconic companies: 3M Company and Delta Air Lines, Inc., from 2014 to 2024.
3M, a stalwart in the manufacturing sector, has seen its SG&A expenses fluctuate, peaking dramatically in 2023 with a staggering 215% increase compared to 2014. This surge reflects strategic investments and perhaps the challenges of scaling operations globally. In contrast, Delta Air Lines, a titan in the aviation industry, experienced a more stable trajectory, with a notable dip in 2020, likely due to the pandemic's impact on travel. By 2024, Delta's expenses rebounded to a more typical level, showcasing resilience in turbulent times.
This comparative analysis underscores the diverse challenges and strategies of these industry leaders, offering valuable insights for investors and business enthusiasts alike.