| __timestamp | 3M Company | W.W. Grainger, Inc. |
|---|---|---|
| Wednesday, January 1, 2014 | 15374000000 | 4314242000 |
| Thursday, January 1, 2015 | 14891000000 | 4231428000 |
| Friday, January 1, 2016 | 15069000000 | 4114557000 |
| Sunday, January 1, 2017 | 15656000000 | 4097557000 |
| Monday, January 1, 2018 | 16083000000 | 4348000000 |
| Tuesday, January 1, 2019 | 15000000000 | 4397000000 |
| Wednesday, January 1, 2020 | 15579000000 | 4238000000 |
| Friday, January 1, 2021 | 16560000000 | 4720000000 |
| Saturday, January 1, 2022 | 14997000000 | 5849000000 |
| Sunday, January 1, 2023 | 14204000000 | 6496000000 |
| Monday, January 1, 2024 | 10128000000 | 6758000000 |
In pursuit of knowledge
In the ever-evolving landscape of industrial giants, 3M Company and W.W. Grainger, Inc. have showcased intriguing gross profit trends over the past decade. From 2014 to 2023, 3M's gross profit exhibited a fluctuating pattern, peaking in 2021 with a 10% increase from 2014, before experiencing a decline by 2023. In contrast, W.W. Grainger, Inc. demonstrated a steady upward trajectory, with a remarkable 50% growth in gross profit by 2023 compared to 2014. This divergence highlights the resilience and strategic adaptability of W.W. Grainger, Inc. in a competitive market. Notably, the data for 2024 remains incomplete, leaving room for speculation on future trends. As these industry leaders navigate economic challenges, their financial performance offers valuable insights into the broader industrial sector's dynamics.
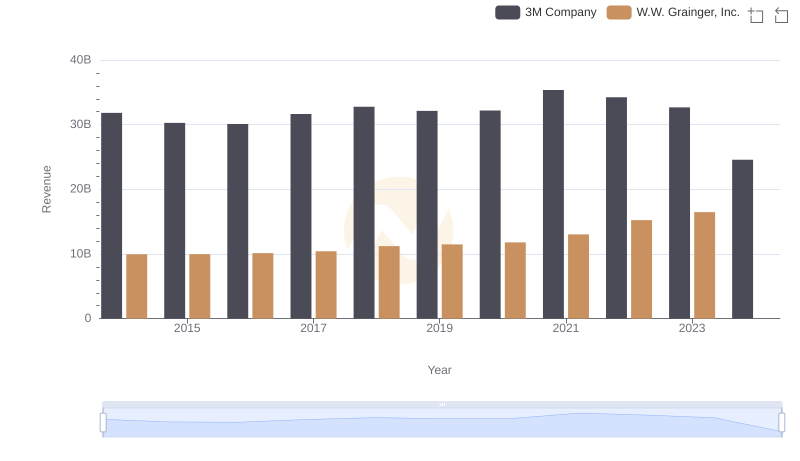
3M Company vs W.W. Grainger, Inc.: Examining Key Revenue Metrics
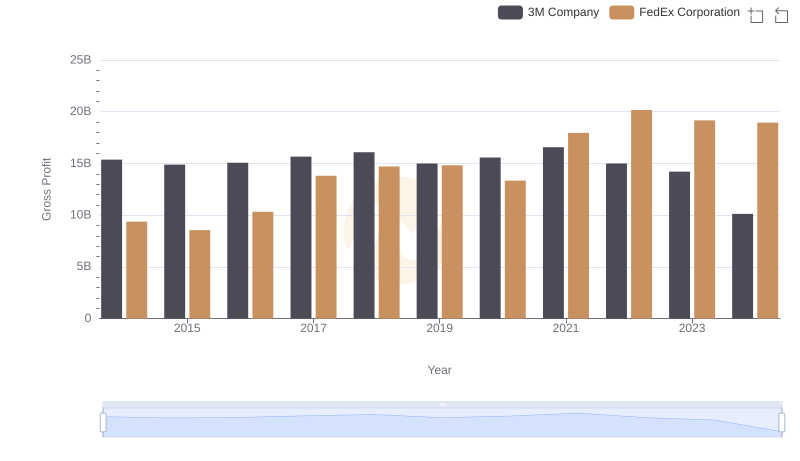
Gross Profit Comparison: 3M Company and FedEx Corporation Trends
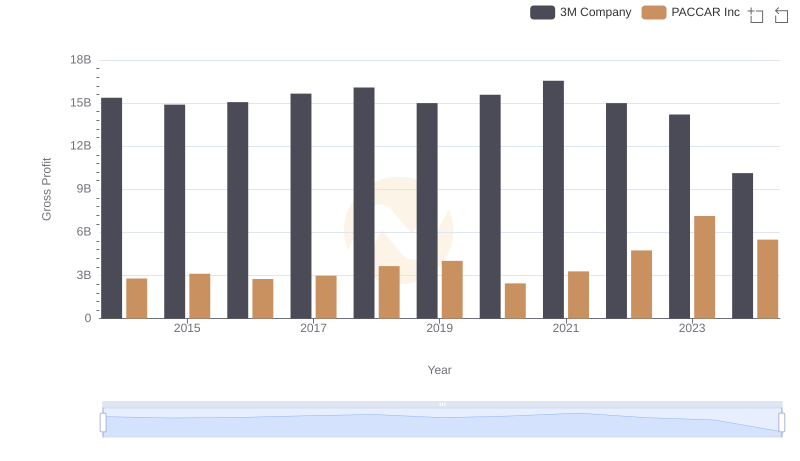
3M Company and PACCAR Inc: A Detailed Gross Profit Analysis
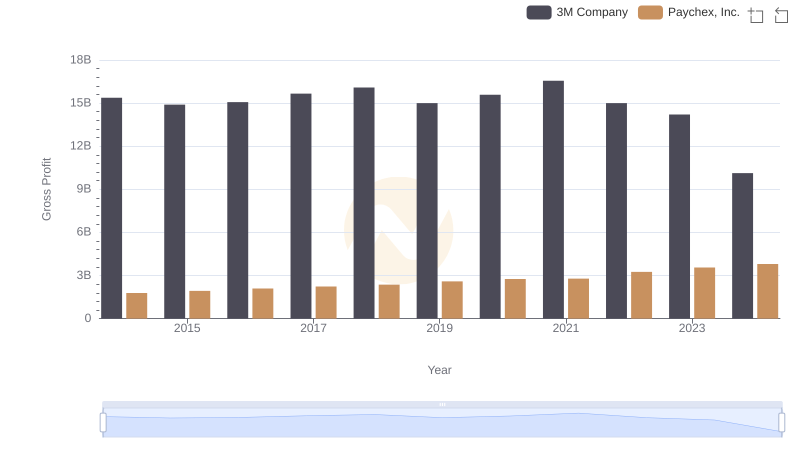
3M Company vs Paychex, Inc.: A Gross Profit Performance Breakdown
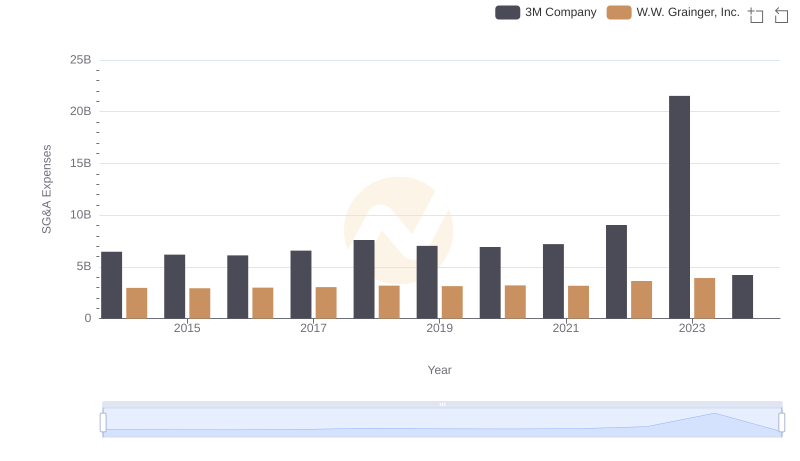
3M Company vs W.W. Grainger, Inc.: SG&A Expense Trends