| __timestamp | 3M Company | Quanta Services, Inc. |
|---|---|---|
| Wednesday, January 1, 2014 | 16447000000 | 6617730000 |
| Thursday, January 1, 2015 | 15383000000 | 6648771000 |
| Friday, January 1, 2016 | 15040000000 | 6637519000 |
| Sunday, January 1, 2017 | 16001000000 | 8224618000 |
| Monday, January 1, 2018 | 16682000000 | 9691459000 |
| Tuesday, January 1, 2019 | 17136000000 | 10511901000 |
| Wednesday, January 1, 2020 | 16605000000 | 9541825000 |
| Friday, January 1, 2021 | 18795000000 | 11026954000 |
| Saturday, January 1, 2022 | 19232000000 | 14544748000 |
| Sunday, January 1, 2023 | 18477000000 | 17945120000 |
| Monday, January 1, 2024 | 14447000000 |
Unveiling the hidden dimensions of data
In the ever-evolving landscape of industrial giants, understanding cost efficiency is paramount. From 2014 to 2023, 3M Company and Quanta Services, Inc. have showcased intriguing trends in their cost of revenue. Notably, 3M's cost efficiency has seen fluctuations, peaking in 2022 with a 15% increase from 2014, before a notable dip in 2024. Meanwhile, Quanta Services, Inc. has demonstrated a remarkable upward trajectory, with a staggering 171% increase in cost of revenue from 2014 to 2023. This growth reflects Quanta's aggressive expansion and strategic investments. However, the absence of data for Quanta in 2024 leaves room for speculation. As these companies navigate the complexities of the global market, their cost efficiency strategies will undoubtedly play a crucial role in shaping their future success.
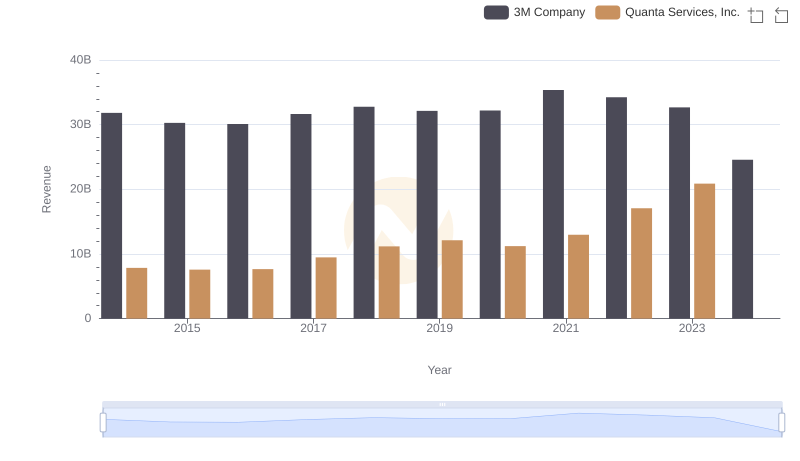
Comparing Revenue Performance: 3M Company or Quanta Services, Inc.?
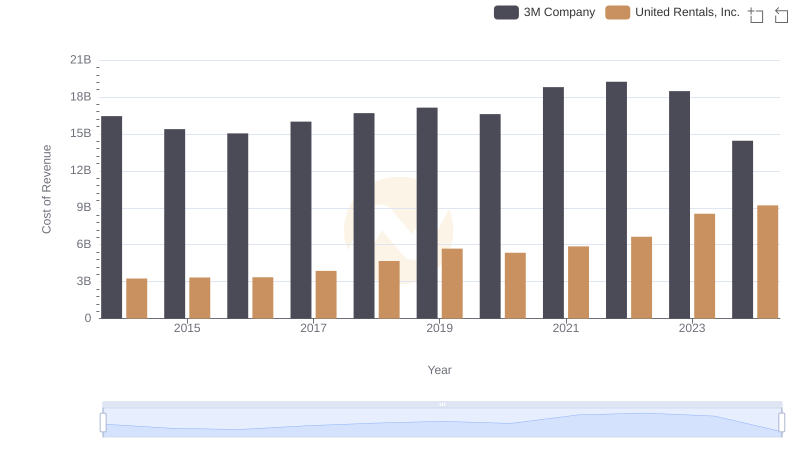
3M Company vs United Rentals, Inc.: Efficiency in Cost of Revenue Explored
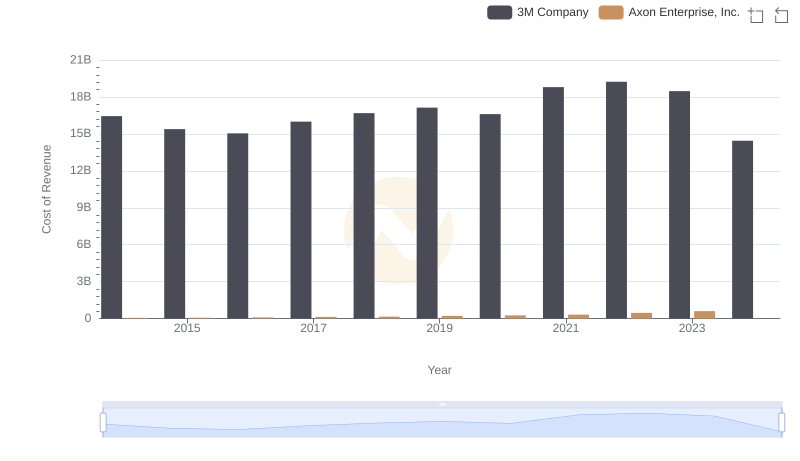
Cost of Revenue Trends: 3M Company vs Axon Enterprise, Inc.
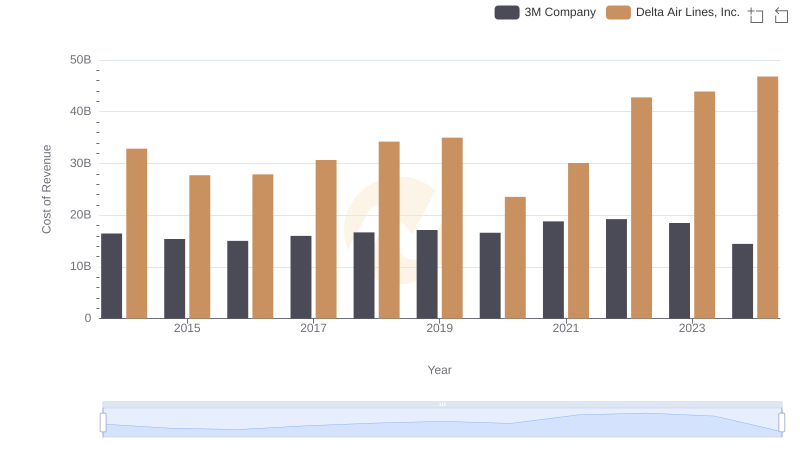
Analyzing Cost of Revenue: 3M Company and Delta Air Lines, Inc.
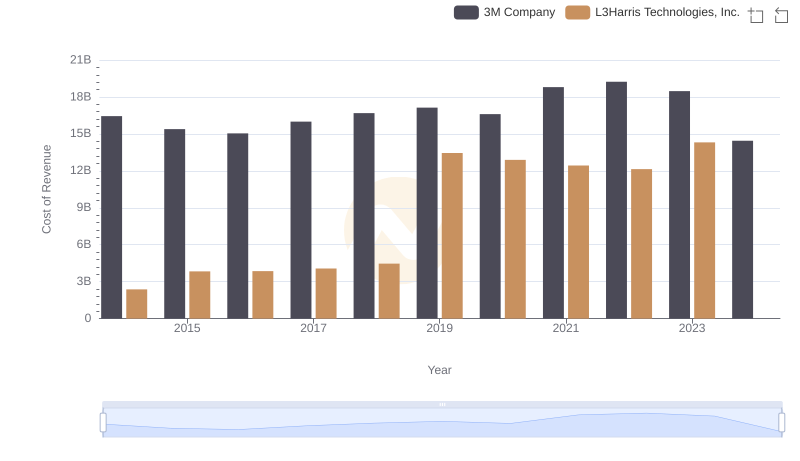
Cost of Revenue Trends: 3M Company vs L3Harris Technologies, Inc.
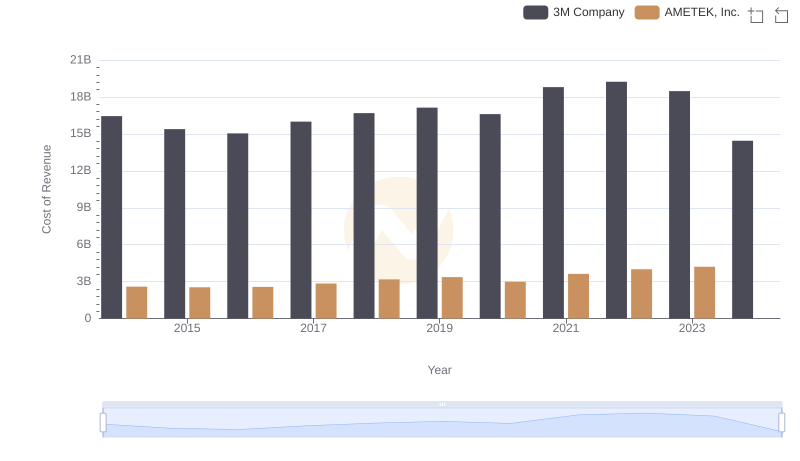
Cost of Revenue Comparison: 3M Company vs AMETEK, Inc.
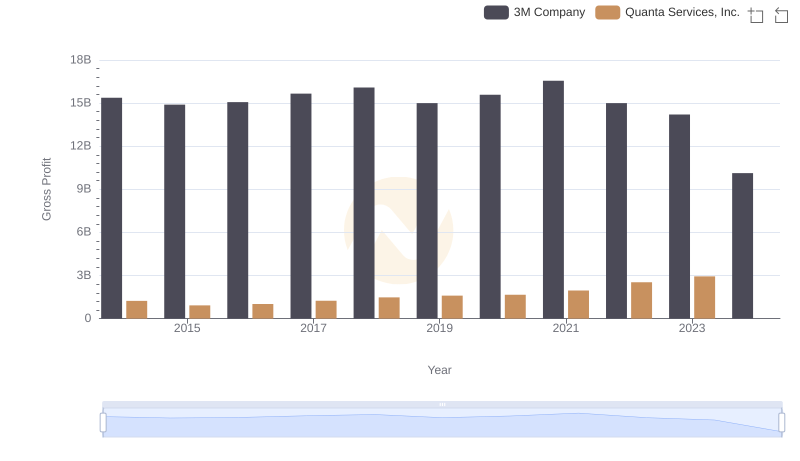
Gross Profit Comparison: 3M Company and Quanta Services, Inc. Trends