| __timestamp | 3M Company | United Rentals, Inc. |
|---|---|---|
| Wednesday, January 1, 2014 | 16447000000 | 3253000000 |
| Thursday, January 1, 2015 | 15383000000 | 3337000000 |
| Friday, January 1, 2016 | 15040000000 | 3359000000 |
| Sunday, January 1, 2017 | 16001000000 | 3872000000 |
| Monday, January 1, 2018 | 16682000000 | 4683000000 |
| Tuesday, January 1, 2019 | 17136000000 | 5681000000 |
| Wednesday, January 1, 2020 | 16605000000 | 5347000000 |
| Friday, January 1, 2021 | 18795000000 | 5863000000 |
| Saturday, January 1, 2022 | 19232000000 | 6646000000 |
| Sunday, January 1, 2023 | 18477000000 | 8519000000 |
| Monday, January 1, 2024 | 14447000000 | 9195000000 |
Data in motion
In the ever-evolving landscape of industrial giants, understanding cost efficiency is crucial. This analysis delves into the cost of revenue trends for 3M Company and United Rentals, Inc. from 2014 to 2024. Over this decade, 3M's cost of revenue has shown a steady increase, peaking in 2022 with a 17% rise from 2014. However, 2024 marks a significant drop, indicating potential strategic shifts or market challenges. In contrast, United Rentals, Inc. has demonstrated a robust upward trajectory, with a staggering 183% increase in cost of revenue from 2014 to 2024. This growth reflects the company's aggressive expansion and market penetration strategies. The data highlights the contrasting approaches of these two industry leaders, offering insights into their operational efficiencies and market dynamics. As we move forward, monitoring these trends will be essential for investors and industry analysts alike.
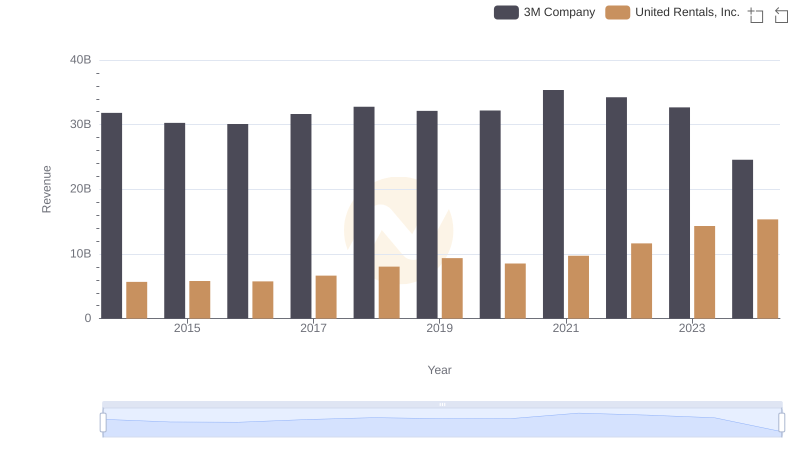
Who Generates More Revenue? 3M Company or United Rentals, Inc.
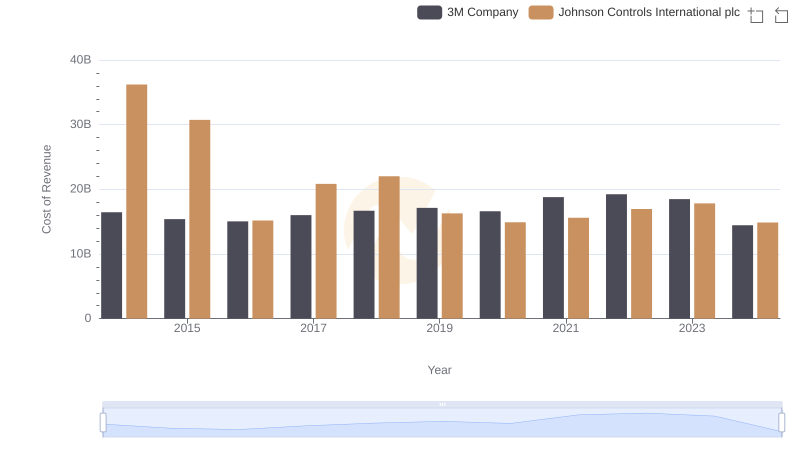
Cost Insights: Breaking Down 3M Company and Johnson Controls International plc's Expenses
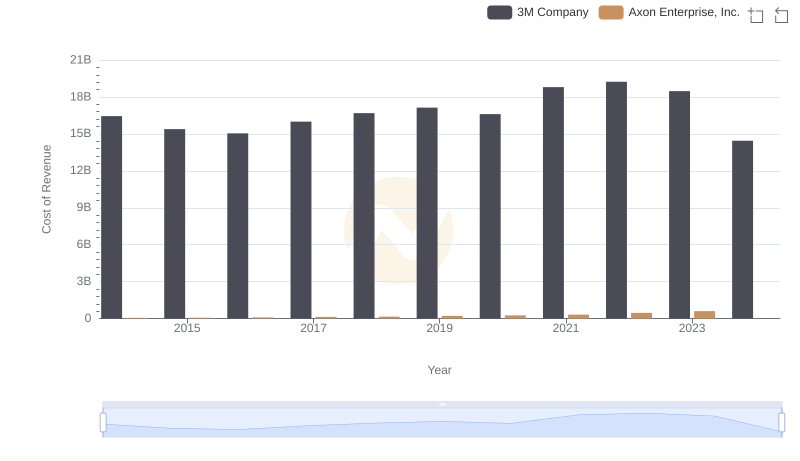
Cost of Revenue Trends: 3M Company vs Axon Enterprise, Inc.
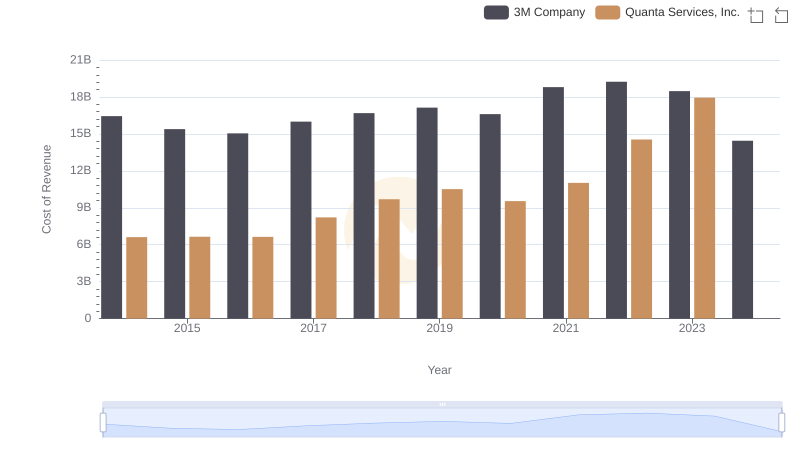
3M Company vs Quanta Services, Inc.: Efficiency in Cost of Revenue Explored
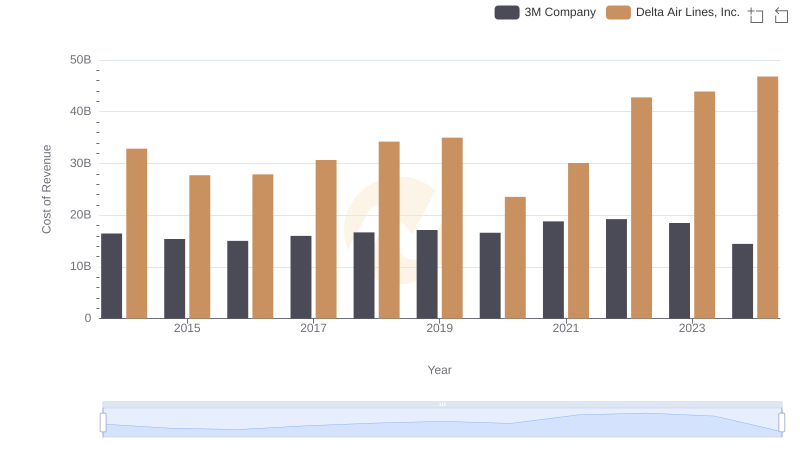
Analyzing Cost of Revenue: 3M Company and Delta Air Lines, Inc.