| __timestamp | 3M Company | Delta Air Lines, Inc. |
|---|---|---|
| Wednesday, January 1, 2014 | 16447000000 | 32858000000 |
| Thursday, January 1, 2015 | 15383000000 | 27707000000 |
| Friday, January 1, 2016 | 15040000000 | 27876000000 |
| Sunday, January 1, 2017 | 16001000000 | 30671000000 |
| Monday, January 1, 2018 | 16682000000 | 34209000000 |
| Tuesday, January 1, 2019 | 17136000000 | 34982000000 |
| Wednesday, January 1, 2020 | 16605000000 | 23546000000 |
| Friday, January 1, 2021 | 18795000000 | 30078000000 |
| Saturday, January 1, 2022 | 19232000000 | 42767000000 |
| Sunday, January 1, 2023 | 18477000000 | 43913000000 |
| Monday, January 1, 2024 | 14447000000 | 46801000000 |
Infusing magic into the data realm
In the ever-evolving landscape of American industry, 3M Company and Delta Air Lines, Inc. stand as titans in their respective fields. From 2014 to 2024, these companies have navigated the turbulent waters of economic change, with their cost of revenue reflecting their strategic maneuvers.
3M Company, a stalwart in manufacturing, saw its cost of revenue fluctuate modestly, peaking in 2022 with a 15% increase from 2014. However, by 2024, it experienced a notable decline, dropping by approximately 25% from its 2022 high. This suggests a strategic shift towards efficiency and cost management.
Conversely, Delta Air Lines, Inc., a leader in aviation, witnessed a dramatic 42% surge in cost of revenue from 2014 to 2024, highlighting the airline's expansion and adaptation to increased demand. The pandemic year of 2020 marked a temporary dip, but recovery was swift, with costs soaring by 99% by 2024.
These trends underscore the dynamic nature of these industries and the strategic decisions that shape their financial landscapes.
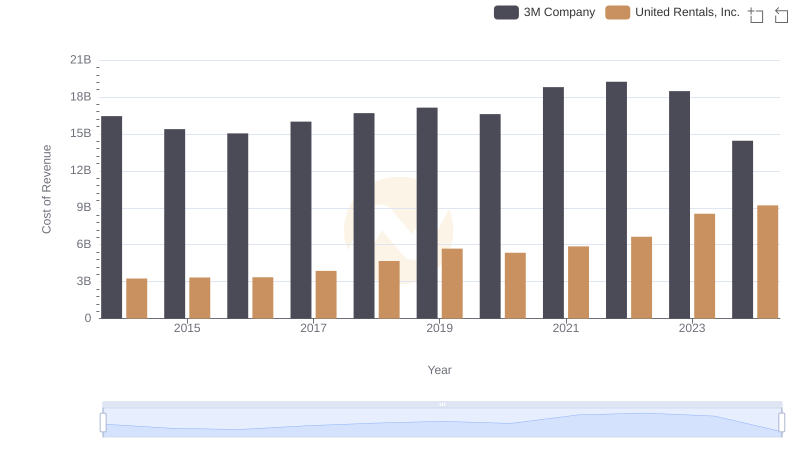
3M Company vs United Rentals, Inc.: Efficiency in Cost of Revenue Explored
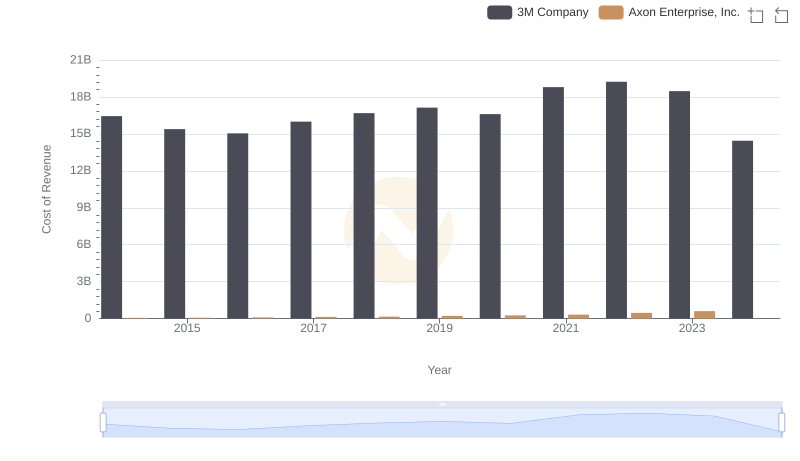
Cost of Revenue Trends: 3M Company vs Axon Enterprise, Inc.
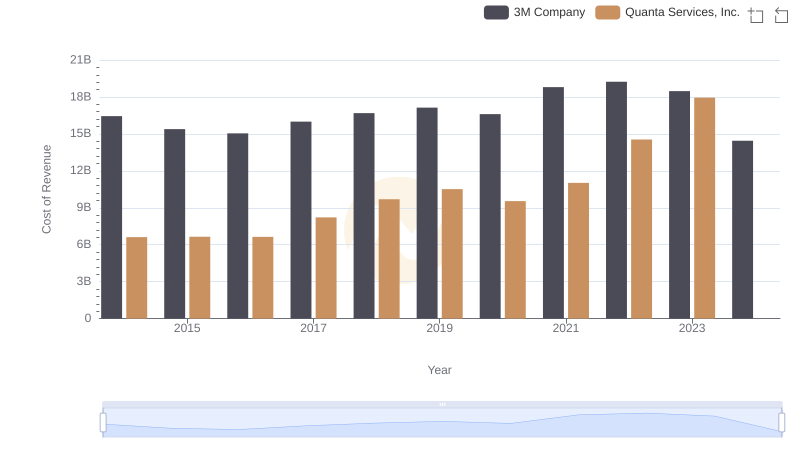
3M Company vs Quanta Services, Inc.: Efficiency in Cost of Revenue Explored
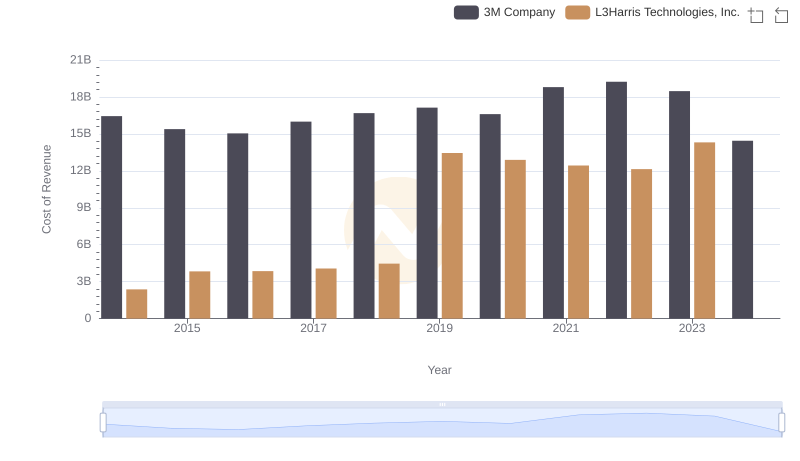
Cost of Revenue Trends: 3M Company vs L3Harris Technologies, Inc.
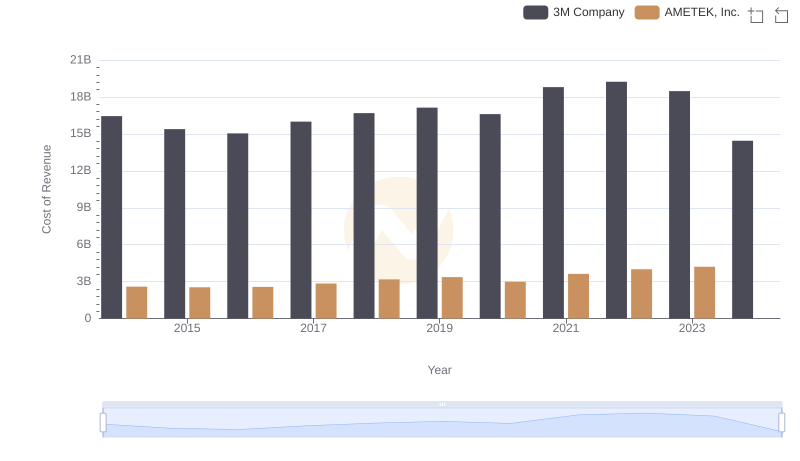
Cost of Revenue Comparison: 3M Company vs AMETEK, Inc.
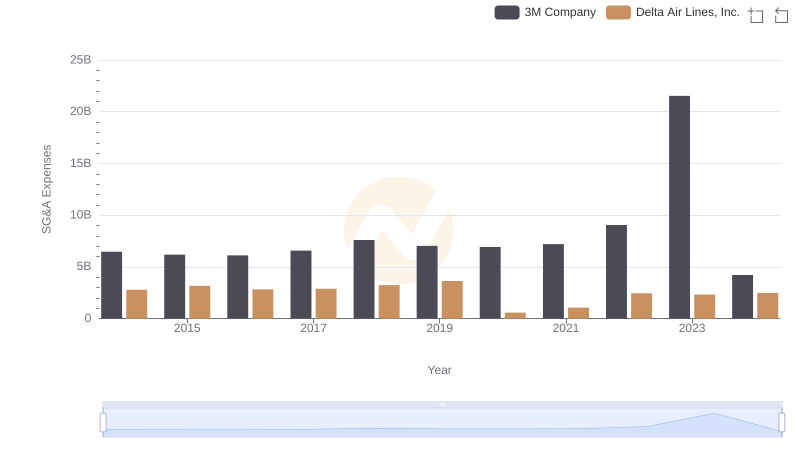
Selling, General, and Administrative Costs: 3M Company vs Delta Air Lines, Inc.

Cost of Revenue Comparison: 3M Company vs Ingersoll Rand Inc.