| __timestamp | 3M Company | Quanta Services, Inc. |
|---|---|---|
| Wednesday, January 1, 2014 | 15374000000 | 1233520000 |
| Thursday, January 1, 2015 | 14891000000 | 923665000 |
| Friday, January 1, 2016 | 15069000000 | 1013800000 |
| Sunday, January 1, 2017 | 15656000000 | 1241860000 |
| Monday, January 1, 2018 | 16083000000 | 1479964000 |
| Tuesday, January 1, 2019 | 15000000000 | 1600252000 |
| Wednesday, January 1, 2020 | 15579000000 | 1660847000 |
| Friday, January 1, 2021 | 16560000000 | 1953259000 |
| Saturday, January 1, 2022 | 14997000000 | 2529155000 |
| Sunday, January 1, 2023 | 14204000000 | 2937086000 |
| Monday, January 1, 2024 | 10128000000 |
Igniting the spark of knowledge
In the ever-evolving landscape of industrial giants, 3M Company and Quanta Services, Inc. have showcased intriguing trends in their gross profit margins over the past decade. From 2014 to 2023, 3M Company consistently maintained a robust gross profit, peaking in 2021 with a 10% increase from 2014. However, a notable decline of approximately 14% was observed by 2023, reflecting potential market challenges or strategic shifts.
Conversely, Quanta Services, Inc. demonstrated a remarkable growth trajectory, with its gross profit more than doubling from 2014 to 2023. This surge, particularly evident from 2021 onwards, underscores Quanta's strategic positioning and market expansion. The data for 2024 remains incomplete, leaving room for speculation on future trends. As these two industry leaders navigate the complexities of the global market, their financial narratives offer valuable insights into the dynamics of industrial profitability.
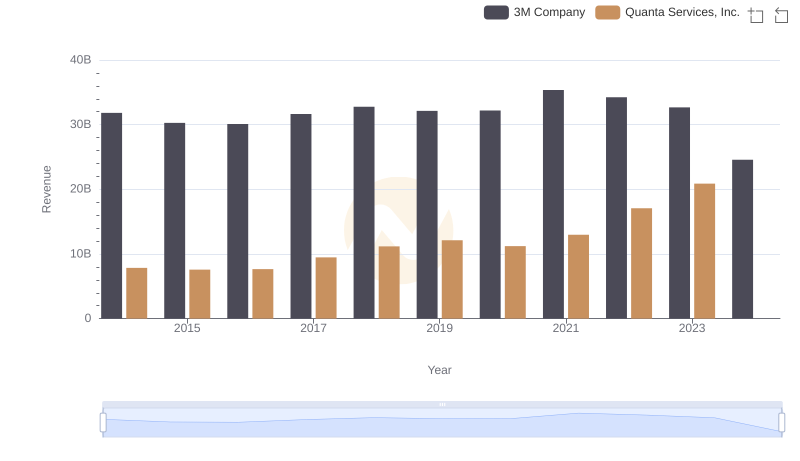
Comparing Revenue Performance: 3M Company or Quanta Services, Inc.?
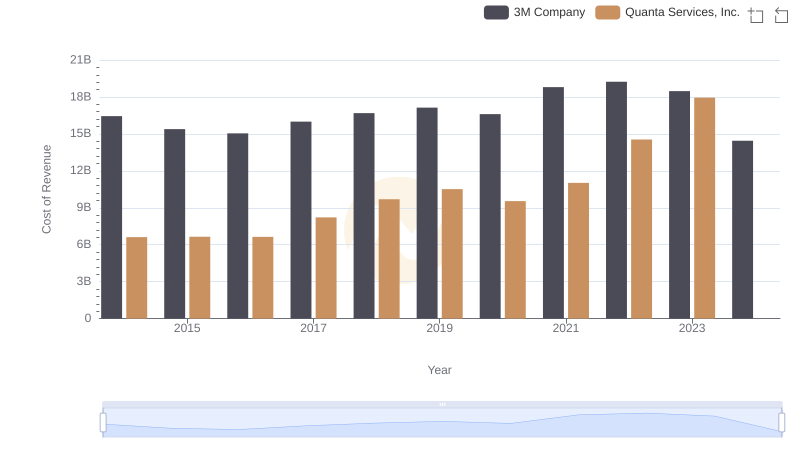
3M Company vs Quanta Services, Inc.: Efficiency in Cost of Revenue Explored

3M Company and AMETEK, Inc.: A Detailed Gross Profit Analysis
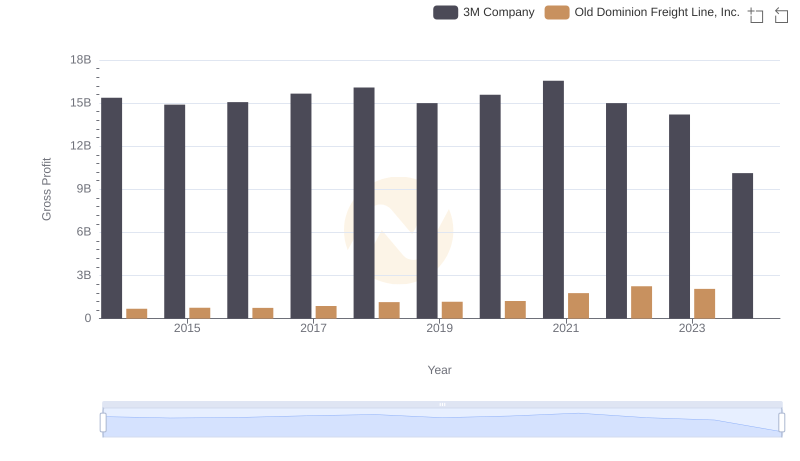
Key Insights on Gross Profit: 3M Company vs Old Dominion Freight Line, Inc.
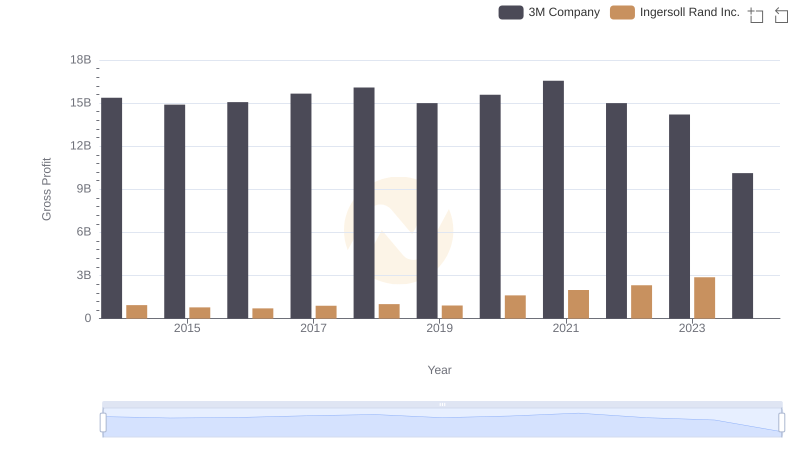
Gross Profit Comparison: 3M Company and Ingersoll Rand Inc. Trends