| __timestamp | 3M Company | Quanta Services, Inc. |
|---|---|---|
| Wednesday, January 1, 2014 | 31821000000 | 7851250000 |
| Thursday, January 1, 2015 | 30274000000 | 7572436000 |
| Friday, January 1, 2016 | 30109000000 | 7651319000 |
| Sunday, January 1, 2017 | 31657000000 | 9466478000 |
| Monday, January 1, 2018 | 32765000000 | 11171423000 |
| Tuesday, January 1, 2019 | 32136000000 | 12112153000 |
| Wednesday, January 1, 2020 | 32184000000 | 11202672000 |
| Friday, January 1, 2021 | 35355000000 | 12980213000 |
| Saturday, January 1, 2022 | 34229000000 | 17073903000 |
| Sunday, January 1, 2023 | 32681000000 | 20882206000 |
| Monday, January 1, 2024 | 24575000000 |
Unlocking the unknown
In the ever-evolving landscape of American industry, 3M Company and Quanta Services, Inc. stand as titans in their respective fields. From 2014 to 2023, these companies have showcased distinct revenue trajectories. 3M, a stalwart in manufacturing, saw its revenue peak in 2021, with a notable 11% increase from 2020. However, by 2023, it experienced a slight decline, dropping by 8% from its 2021 high. In contrast, Quanta Services, a leader in infrastructure solutions, demonstrated a remarkable growth story. From 2014 to 2023, Quanta's revenue surged by an impressive 166%, reflecting its strategic expansion and market adaptation. While 3M's revenue faced fluctuations, Quanta's consistent upward trend highlights its resilience and growth potential. As we look to the future, these trends offer valuable insights into the dynamic nature of industrial growth and competition.
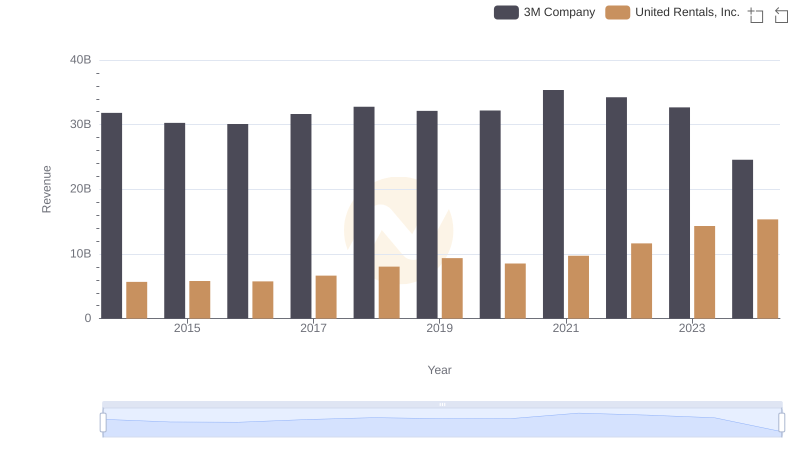
Who Generates More Revenue? 3M Company or United Rentals, Inc.
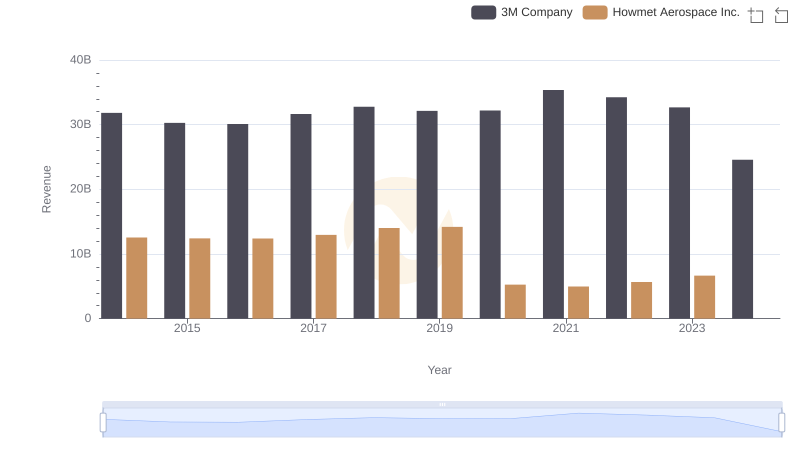
Annual Revenue Comparison: 3M Company vs Howmet Aerospace Inc.
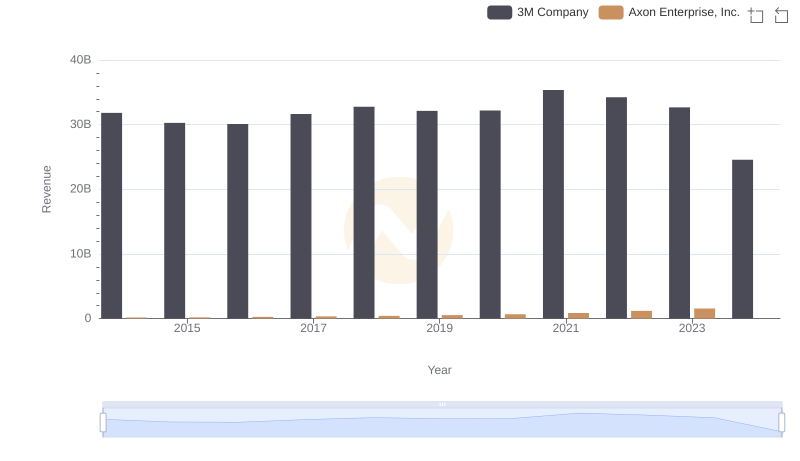
Revenue Showdown: 3M Company vs Axon Enterprise, Inc.
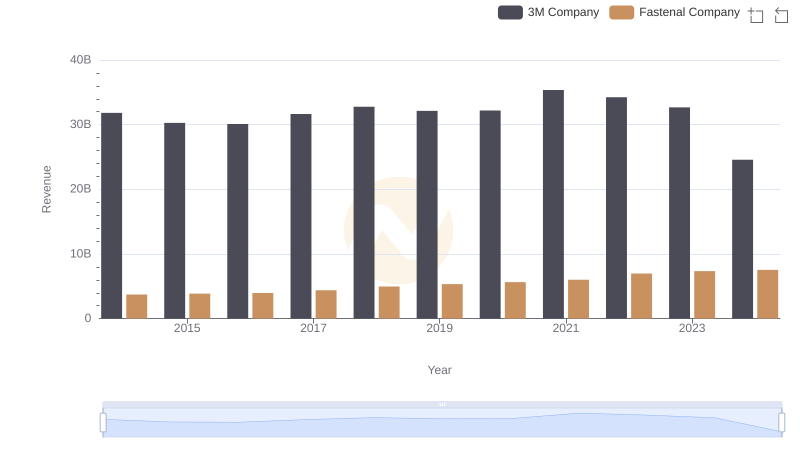
3M Company or Fastenal Company: Who Leads in Yearly Revenue?
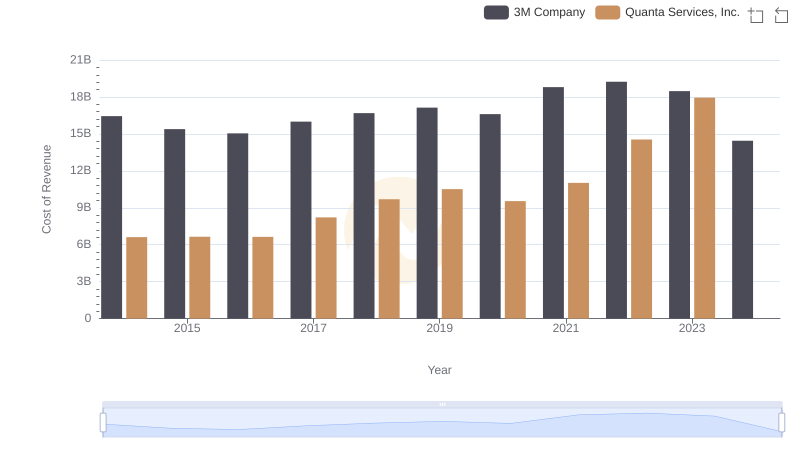
3M Company vs Quanta Services, Inc.: Efficiency in Cost of Revenue Explored
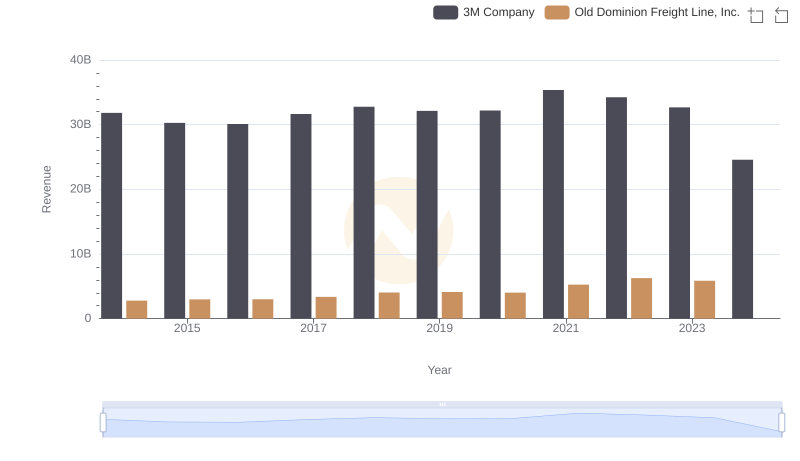
3M Company vs Old Dominion Freight Line, Inc.: Annual Revenue Growth Compared
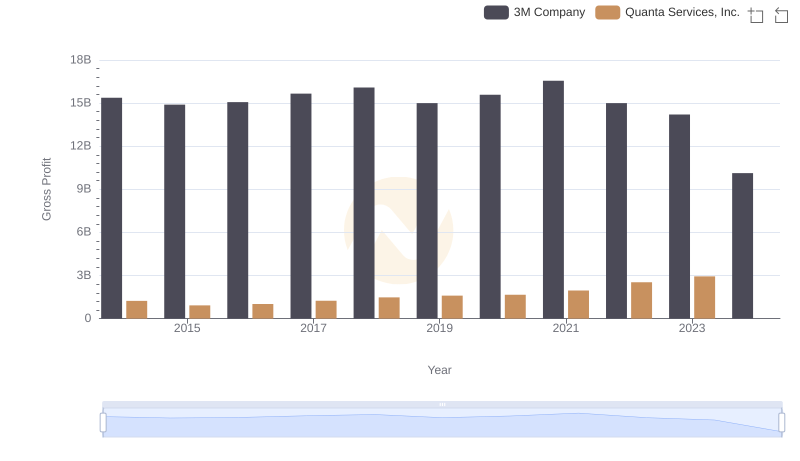
Gross Profit Comparison: 3M Company and Quanta Services, Inc. Trends