| __timestamp | 3M Company | AMETEK, Inc. |
|---|---|---|
| Wednesday, January 1, 2014 | 16447000000 | 2597017000 |
| Thursday, January 1, 2015 | 15383000000 | 2549280000 |
| Friday, January 1, 2016 | 15040000000 | 2575220000 |
| Sunday, January 1, 2017 | 16001000000 | 2851431000 |
| Monday, January 1, 2018 | 16682000000 | 3186310000 |
| Tuesday, January 1, 2019 | 17136000000 | 3370897000 |
| Wednesday, January 1, 2020 | 16605000000 | 2996515000 |
| Friday, January 1, 2021 | 18795000000 | 3633900000 |
| Saturday, January 1, 2022 | 19232000000 | 4005261000 |
| Sunday, January 1, 2023 | 18477000000 | 4212484999 |
| Monday, January 1, 2024 | 14447000000 | 0 |
Cracking the code
In the ever-evolving landscape of industrial manufacturing, 3M Company and AMETEK, Inc. have been pivotal players. Over the past decade, from 2014 to 2023, these two titans have showcased contrasting trajectories in their cost of revenue. 3M Company, a stalwart in the industry, saw its cost of revenue peak in 2022, reaching approximately $19.2 billion, before experiencing a slight decline in 2023. This represents a 17% increase from its 2014 figures. Meanwhile, AMETEK, Inc., a leader in electronic instruments and electromechanical devices, demonstrated a consistent upward trend, with its cost of revenue growing by over 60% from 2014 to 2023, culminating in a record $4.2 billion in 2023. Notably, data for 2024 is incomplete, highlighting the dynamic nature of financial forecasting. This comparison underscores the diverse strategies and market conditions influencing these industry leaders.
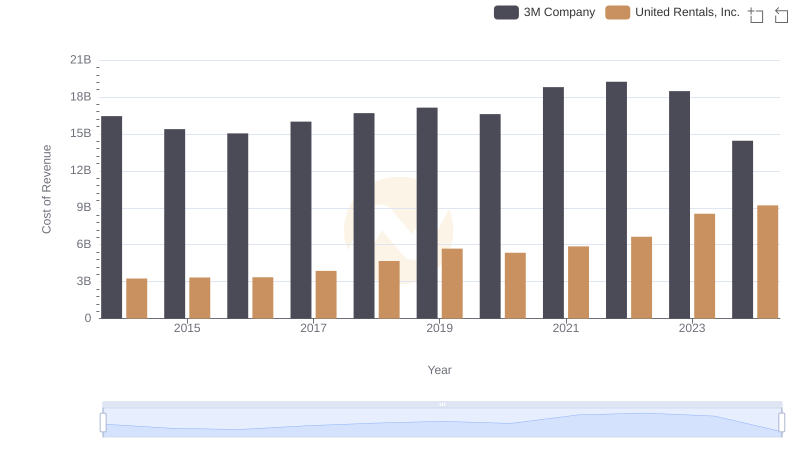
3M Company vs United Rentals, Inc.: Efficiency in Cost of Revenue Explored
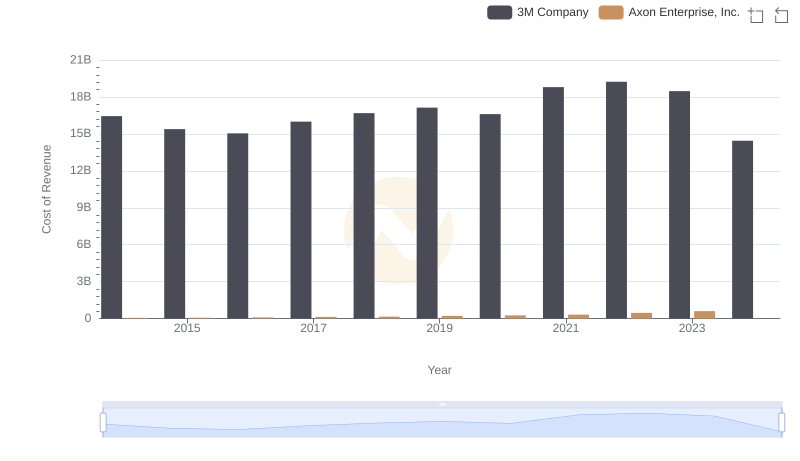
Cost of Revenue Trends: 3M Company vs Axon Enterprise, Inc.
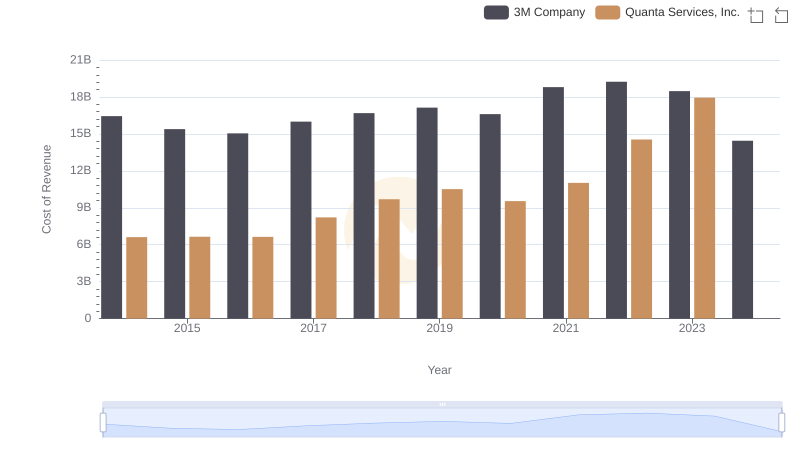
3M Company vs Quanta Services, Inc.: Efficiency in Cost of Revenue Explored
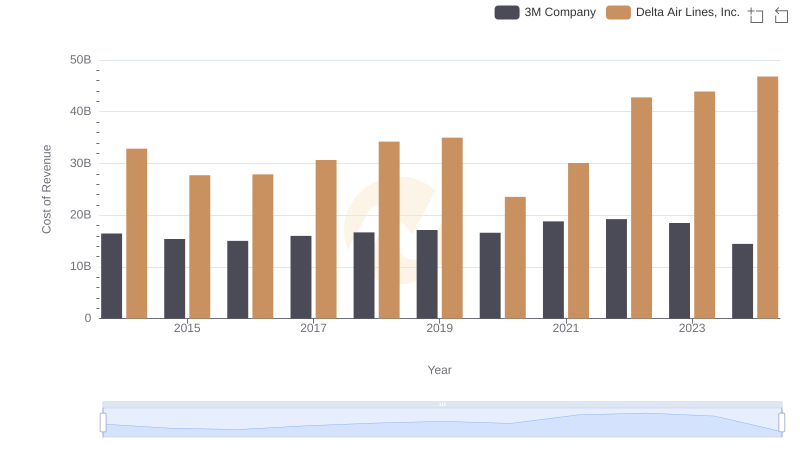
Analyzing Cost of Revenue: 3M Company and Delta Air Lines, Inc.
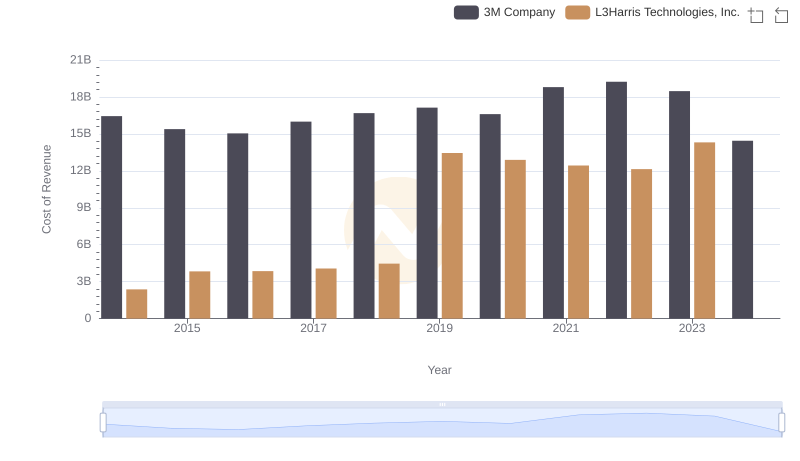
Cost of Revenue Trends: 3M Company vs L3Harris Technologies, Inc.

3M Company and AMETEK, Inc.: A Detailed Gross Profit Analysis

Cost of Revenue Comparison: 3M Company vs Ingersoll Rand Inc.