| __timestamp | 3M Company | Builders FirstSource, Inc. |
|---|---|---|
| Wednesday, January 1, 2014 | 31821000000 | 1604096000 |
| Thursday, January 1, 2015 | 30274000000 | 3564425000 |
| Friday, January 1, 2016 | 30109000000 | 6367284000 |
| Sunday, January 1, 2017 | 31657000000 | 7034209000 |
| Monday, January 1, 2018 | 32765000000 | 7724771000 |
| Tuesday, January 1, 2019 | 32136000000 | 7280431000 |
| Wednesday, January 1, 2020 | 32184000000 | 8558874000 |
| Friday, January 1, 2021 | 35355000000 | 19893856000 |
| Saturday, January 1, 2022 | 34229000000 | 22726418000 |
| Sunday, January 1, 2023 | 32681000000 | 17097330000 |
| Monday, January 1, 2024 | 24575000000 |
Unlocking the unknown
In the ever-evolving landscape of the U.S. stock market, the revenue trajectories of 3M Company and Builders FirstSource, Inc. offer a fascinating glimpse into the dynamics of industrial and construction sectors. Over the past decade, 3M Company has maintained a relatively stable revenue stream, with fluctuations of around 10% from its average. Notably, 3M's revenue peaked in 2021, reflecting a 12% increase from 2014, before experiencing a slight decline in 2023.
Conversely, Builders FirstSource, Inc. has demonstrated a remarkable growth trajectory, with its revenue surging by over 1,300% from 2014 to 2022. This growth underscores the booming demand in the construction industry, particularly during the post-pandemic recovery period. However, 2023 saw a dip, indicating potential market adjustments.
These trends highlight the contrasting paths of a diversified industrial giant and a focused construction leader, each navigating their unique challenges and opportunities.
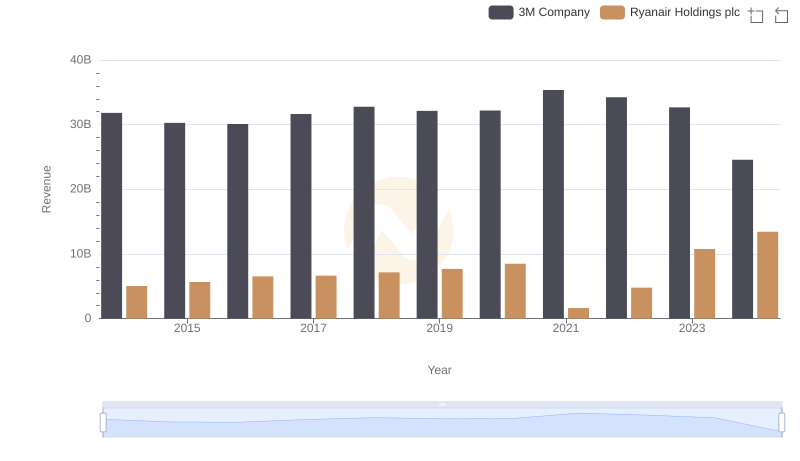
Breaking Down Revenue Trends: 3M Company vs Ryanair Holdings plc
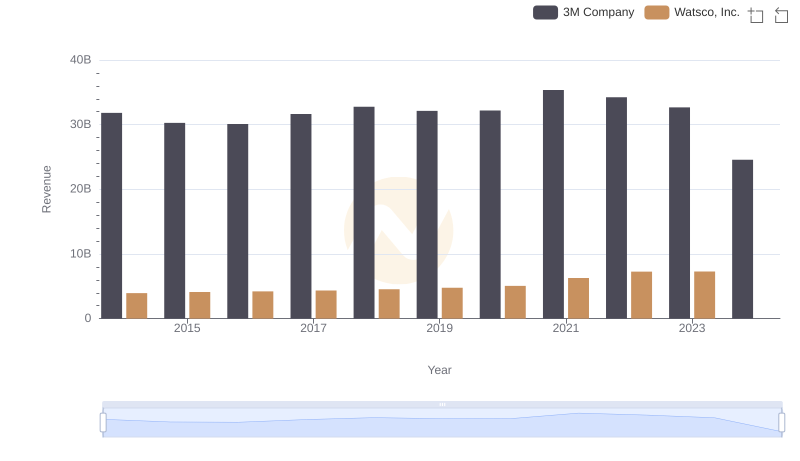
3M Company and Watsco, Inc.: A Comprehensive Revenue Analysis
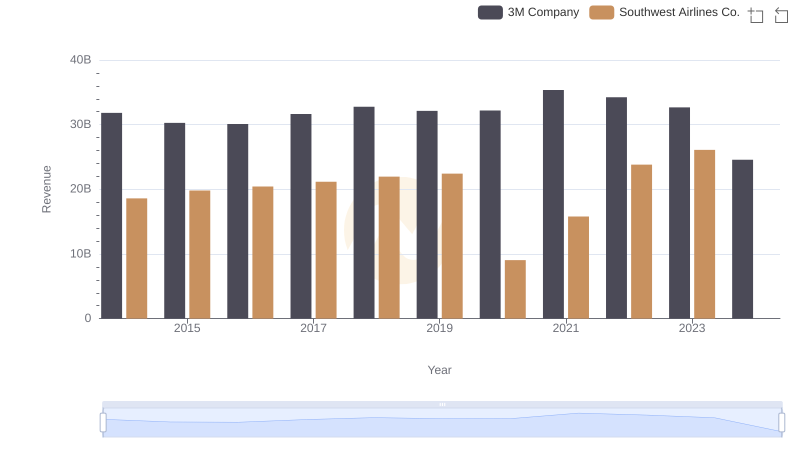
Revenue Showdown: 3M Company vs Southwest Airlines Co.
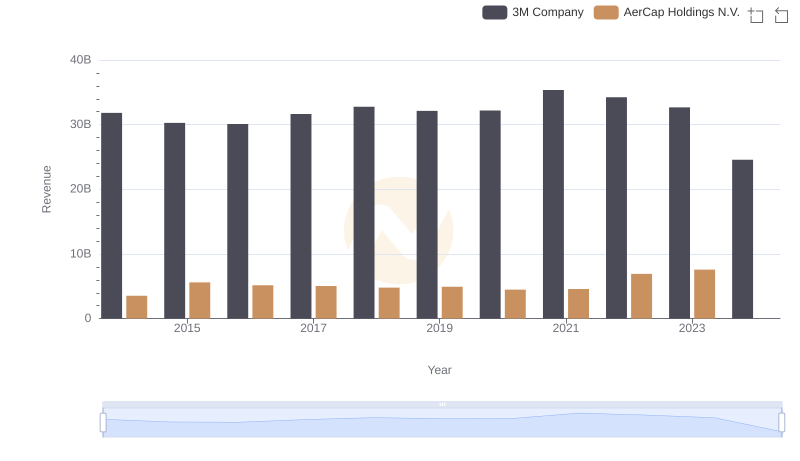
Annual Revenue Comparison: 3M Company vs AerCap Holdings N.V.
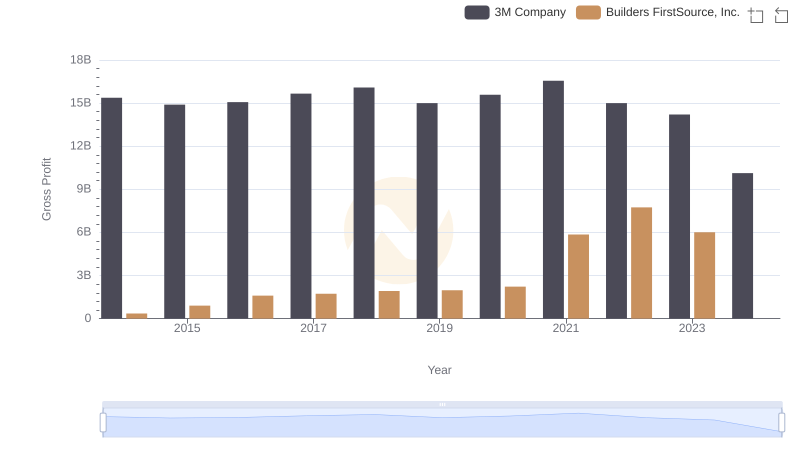
3M Company vs Builders FirstSource, Inc.: A Gross Profit Performance Breakdown