| __timestamp | 3M Company | Lennox International Inc. |
|---|---|---|
| Wednesday, January 1, 2014 | 1770000000 | 60700000 |
| Thursday, January 1, 2015 | 1763000000 | 62300000 |
| Friday, January 1, 2016 | 1735000000 | 64599999 |
| Sunday, January 1, 2017 | 1850000000 | 73600000 |
| Monday, January 1, 2018 | 1821000000 | 72200000 |
| Tuesday, January 1, 2019 | 1911000000 | 69900000 |
| Wednesday, January 1, 2020 | 1878000000 | 66800000 |
| Friday, January 1, 2021 | 1994000000 | 76100000 |
| Saturday, January 1, 2022 | 1862000000 | 80300000 |
| Sunday, January 1, 2023 | 1842000000 | 94000000 |
| Monday, January 1, 2024 | 1085000000 | 0 |
Unleashing the power of data
In the ever-evolving landscape of industrial innovation, research and development (R&D) investments are pivotal. Over the past decade, 3M Company and Lennox International Inc. have demonstrated contrasting strategies in their R&D expenditures. From 2014 to 2023, 3M consistently allocated a significant portion of its resources to R&D, peaking in 2021 with a 13% increase from 2014. This commitment underscores 3M's dedication to maintaining its competitive edge through innovation.
Conversely, Lennox International Inc. exhibited a more conservative approach, with R&D spending growing by approximately 55% over the same period. Notably, Lennox's R&D investment in 2023 was 94% lower than 3M's, highlighting differing priorities and market strategies. The absence of data for Lennox in 2024 suggests a potential shift or reevaluation in their R&D focus. As these companies navigate the future, their R&D investments will continue to shape their trajectories in the global market.
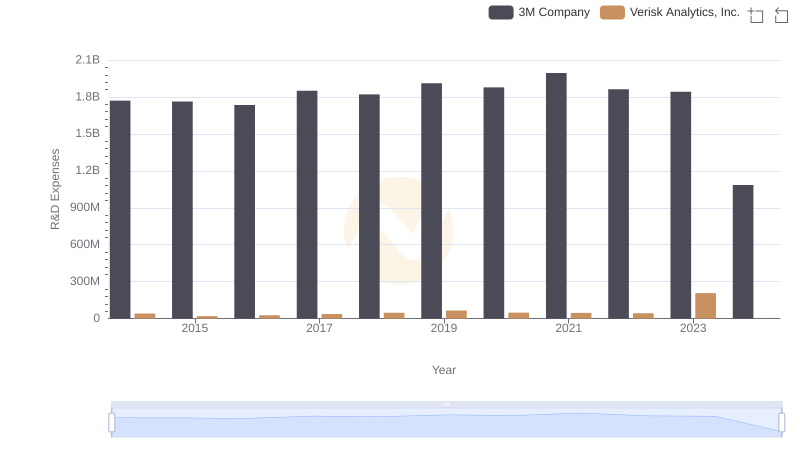
Research and Development Expenses Breakdown: 3M Company vs Verisk Analytics, Inc.
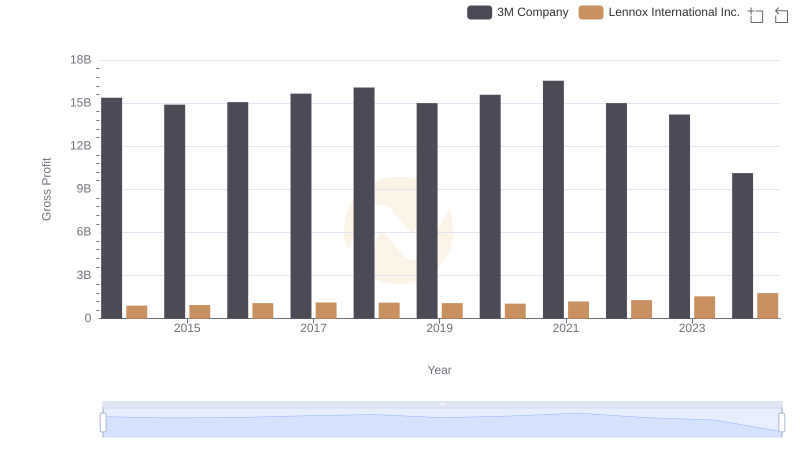
Who Generates Higher Gross Profit? 3M Company or Lennox International Inc.
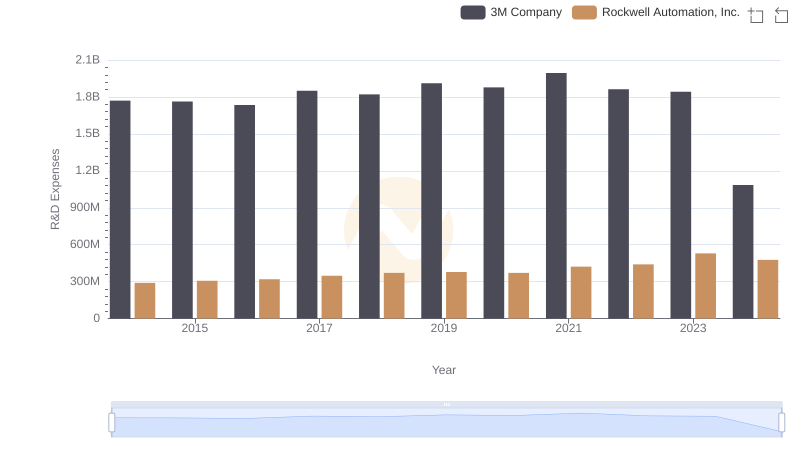
Research and Development Investment: 3M Company vs Rockwell Automation, Inc.
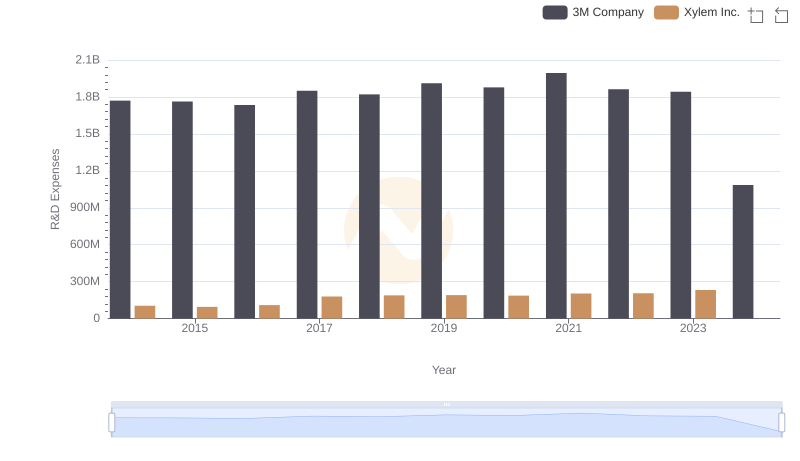
R&D Insights: How 3M Company and Xylem Inc. Allocate Funds
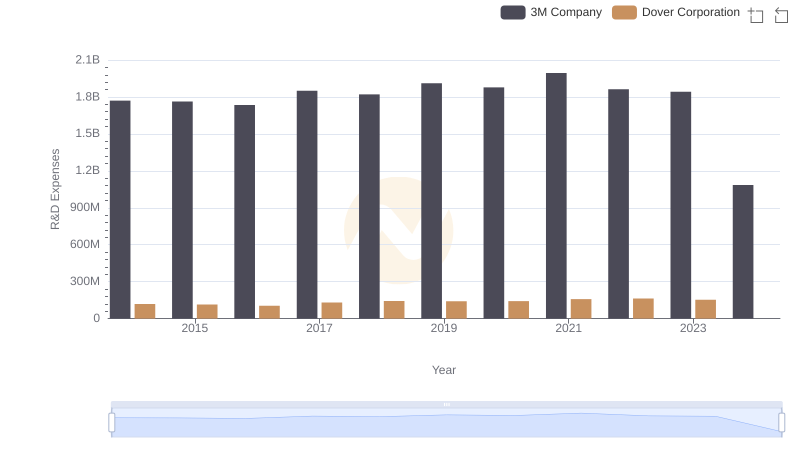
3M Company vs Dover Corporation: Strategic Focus on R&D Spending
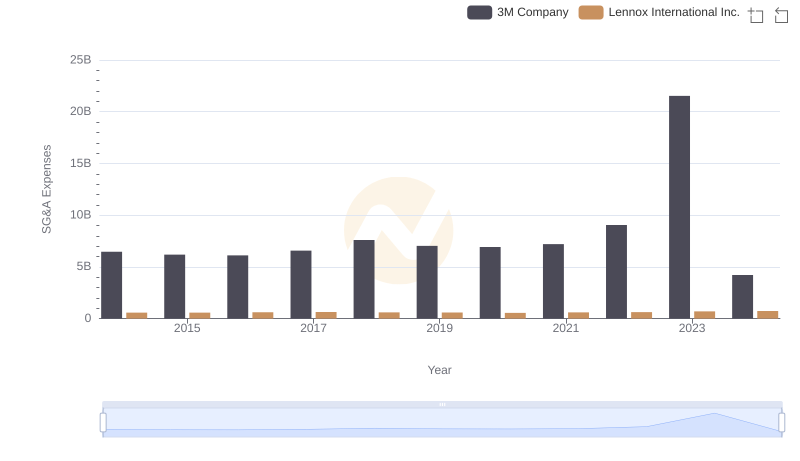
3M Company and Lennox International Inc.: SG&A Spending Patterns Compared
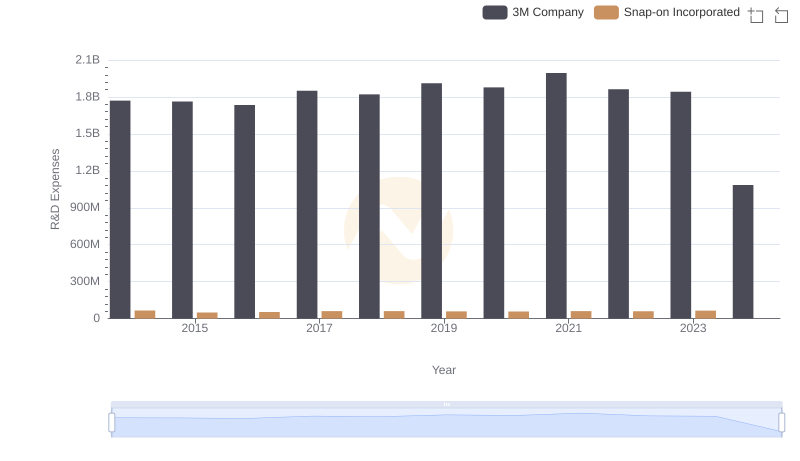
Who Prioritizes Innovation? R&D Spending Compared for 3M Company and Snap-on Incorporated