| __timestamp | ASE Technology Holding Co., Ltd. | Tyler Technologies, Inc. |
|---|---|---|
| Wednesday, January 1, 2014 | 256591000000 | 493101000 |
| Thursday, January 1, 2015 | 283302000000 | 591022000 |
| Friday, January 1, 2016 | 274884000000 | 756043000 |
| Sunday, January 1, 2017 | 290441000000 | 840662000 |
| Monday, January 1, 2018 | 371092000000 | 935282000 |
| Tuesday, January 1, 2019 | 413182000000 | 1086427000 |
| Wednesday, January 1, 2020 | 476978000000 | 1116663000 |
| Friday, January 1, 2021 | 569997000000 | 1592287000 |
| Saturday, January 1, 2022 | 670873000000 | 1850204000 |
| Sunday, January 1, 2023 | 581914471000 | 1951751000 |
| Monday, January 1, 2024 | 595410063000 | 2137803000 |
Unlocking the unknown
In the ever-evolving landscape of technology, revenue generation is a key indicator of a company's market position and growth potential. Over the past decade, ASE Technology Holding Co., Ltd. has consistently outpaced Tyler Technologies, Inc. in revenue generation. From 2014 to 2023, ASE Technology's revenue surged by approximately 127%, peaking in 2022. In contrast, Tyler Technologies saw a steady increase of around 296% over the same period, albeit from a much smaller base.
ASE Technology's revenue growth reflects its robust position in the semiconductor industry, while Tyler Technologies' steady climb highlights its expanding influence in the public sector software market. Despite the disparity in revenue figures, both companies have demonstrated resilience and adaptability in their respective fields. As we look to the future, the question remains: will Tyler Technologies close the gap, or will ASE Technology continue to dominate?
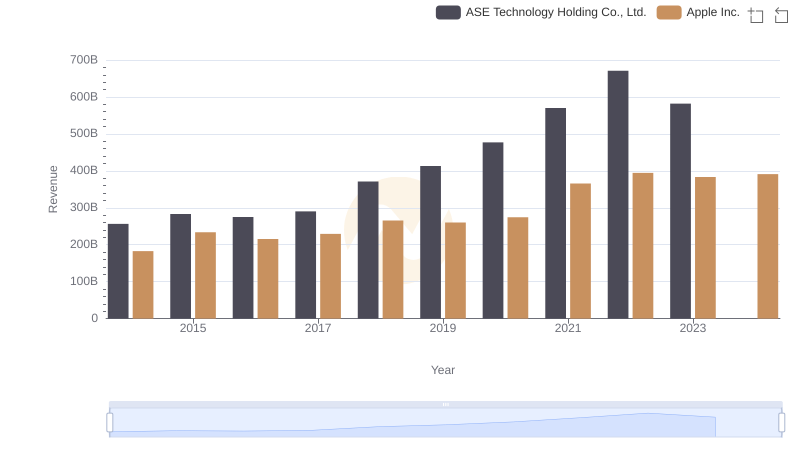
Apple Inc. or ASE Technology Holding Co., Ltd.: Who Leads in Yearly Revenue?

NVIDIA Corporation vs Tyler Technologies, Inc.: Annual Revenue Growth Compared
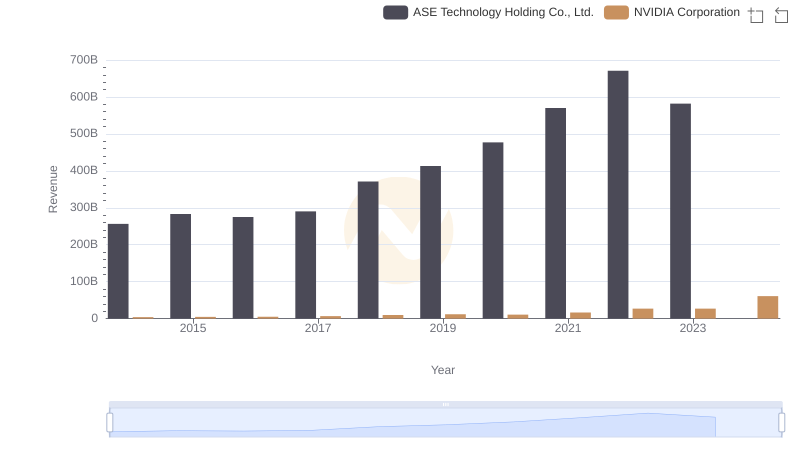
NVIDIA Corporation vs ASE Technology Holding Co., Ltd.: Annual Revenue Growth Compared
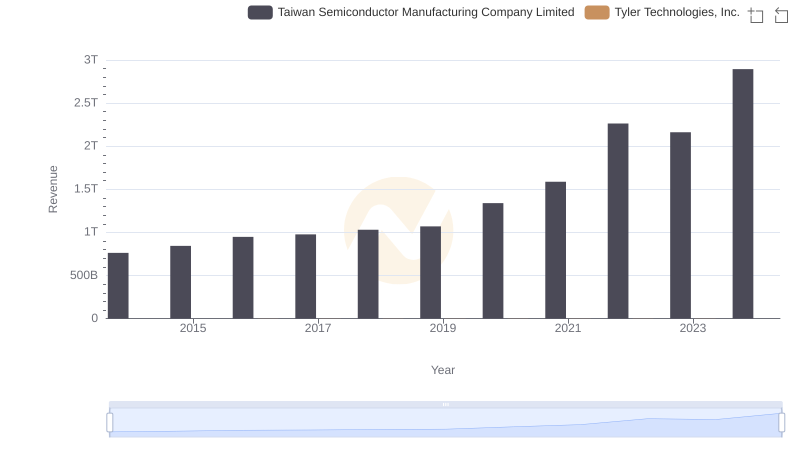
Taiwan Semiconductor Manufacturing Company Limited or Tyler Technologies, Inc.: Who Leads in Yearly Revenue?
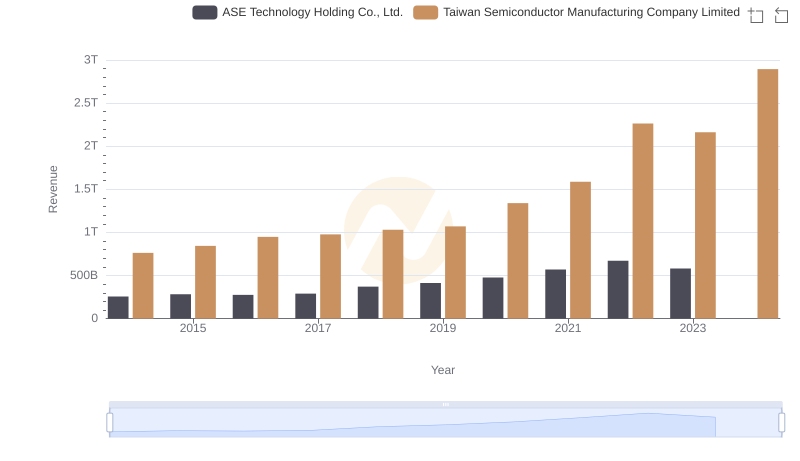
Taiwan Semiconductor Manufacturing Company Limited or ASE Technology Holding Co., Ltd.: Who Leads in Yearly Revenue?
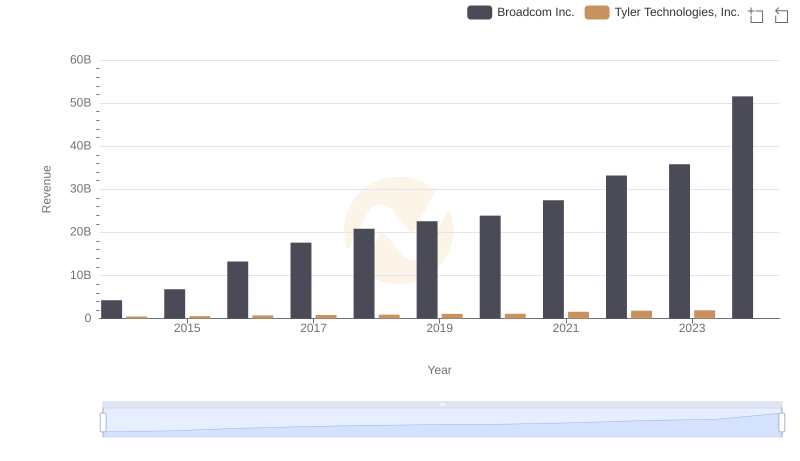
Broadcom Inc. vs Tyler Technologies, Inc.: Annual Revenue Growth Compared
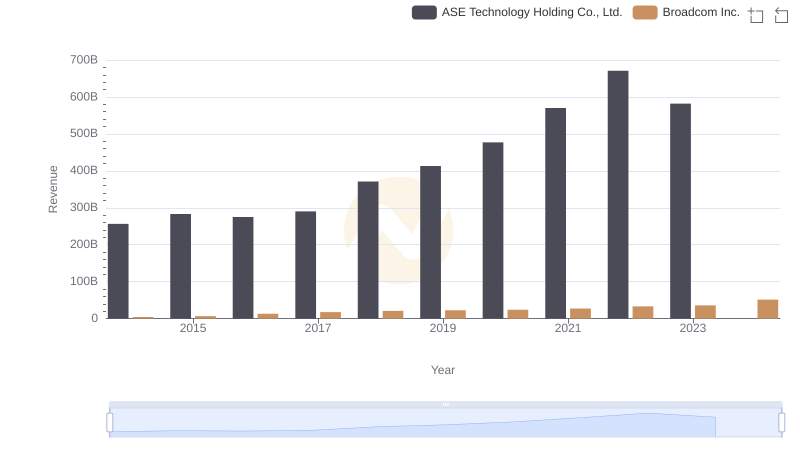
Broadcom Inc. and ASE Technology Holding Co., Ltd.: A Comprehensive Revenue Analysis
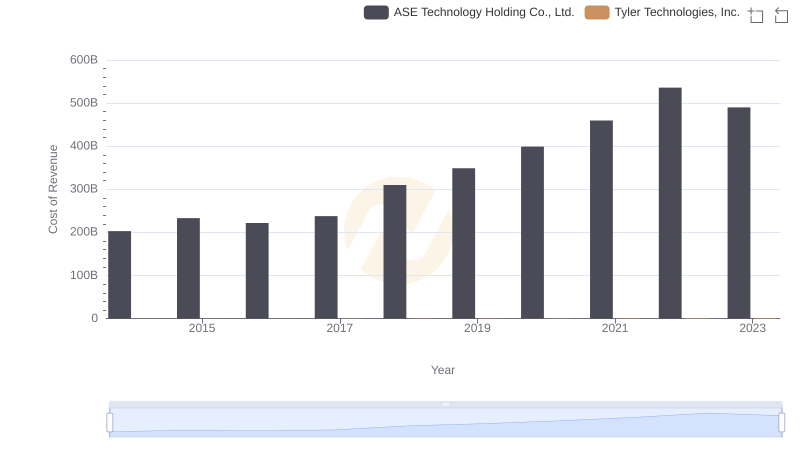
Cost of Revenue Trends: Tyler Technologies, Inc. vs ASE Technology Holding Co., Ltd.
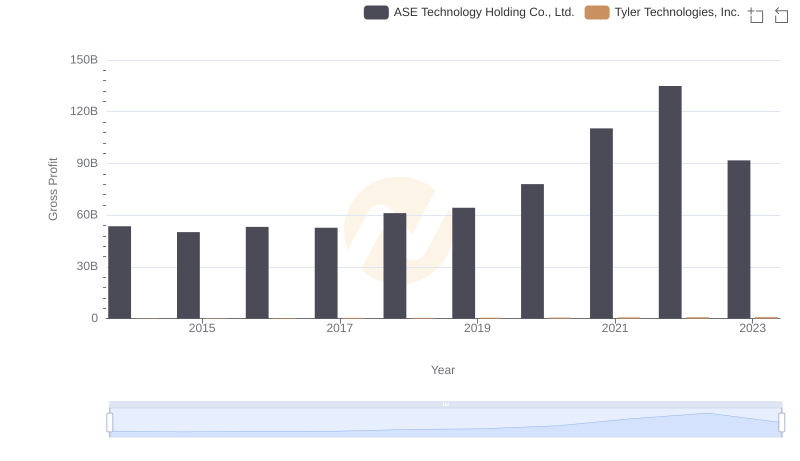
Tyler Technologies, Inc. vs ASE Technology Holding Co., Ltd.: A Gross Profit Performance Breakdown
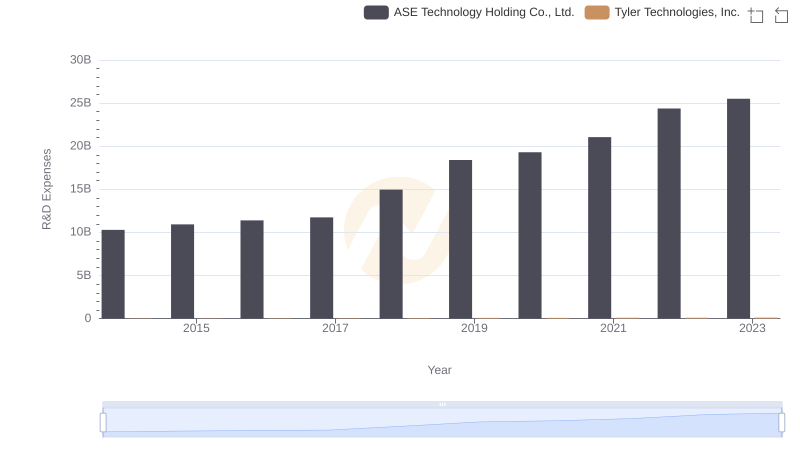
Research and Development Expenses Breakdown: Tyler Technologies, Inc. vs ASE Technology Holding Co., Ltd.
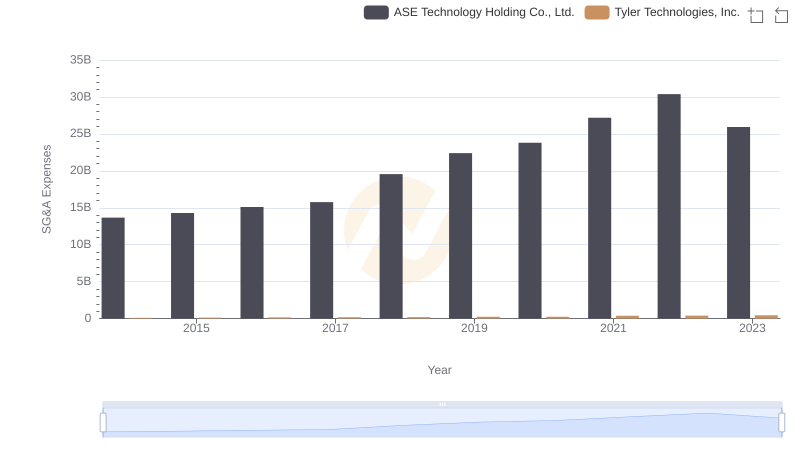
Cost Management Insights: SG&A Expenses for Tyler Technologies, Inc. and ASE Technology Holding Co., Ltd.
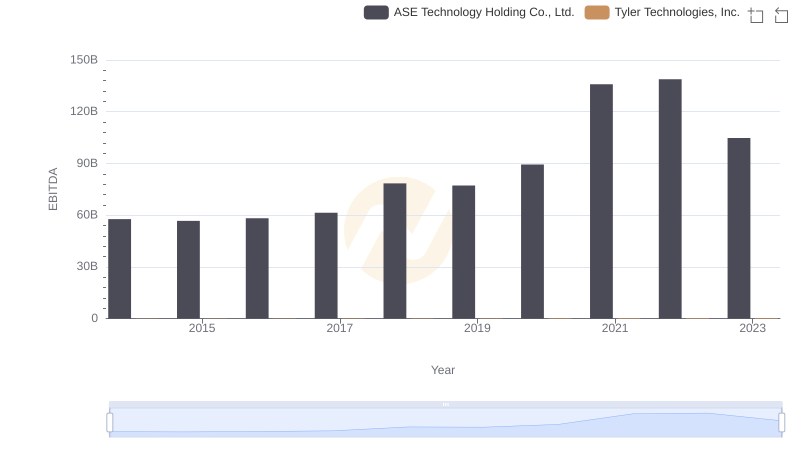
A Professional Review of EBITDA: Tyler Technologies, Inc. Compared to ASE Technology Holding Co., Ltd.