| __timestamp | ASE Technology Holding Co., Ltd. | Tyler Technologies, Inc. |
|---|---|---|
| Wednesday, January 1, 2014 | 53540000000 | 233371000 |
| Thursday, January 1, 2015 | 50149000000 | 277187000 |
| Friday, January 1, 2016 | 53194000000 | 355351000 |
| Sunday, January 1, 2017 | 52732000000 | 399140000 |
| Monday, January 1, 2018 | 61163000000 | 439578000 |
| Tuesday, January 1, 2019 | 64311000000 | 516900000 |
| Wednesday, January 1, 2020 | 77984000000 | 542512000 |
| Friday, January 1, 2021 | 110369000000 | 709644000 |
| Saturday, January 1, 2022 | 134930000000 | 783863000 |
| Sunday, January 1, 2023 | 91757132000 | 861099000 |
| Monday, January 1, 2024 | 95687183000 | 935761000 |
Unlocking the unknown
In the ever-evolving landscape of global technology, Tyler Technologies, Inc. and ASE Technology Holding Co., Ltd. have carved distinct paths in their financial journeys. Over the past decade, ASE Technology has consistently outperformed Tyler Technologies in terms of gross profit, showcasing a staggering growth of approximately 150% from 2014 to 2023. This Taiwanese semiconductor giant peaked in 2022, with a gross profit nearly 15 times that of Tyler Technologies. Meanwhile, Tyler Technologies, a leader in public sector software solutions, has demonstrated steady growth, increasing its gross profit by nearly 270% over the same period. Despite the vast difference in scale, Tyler's consistent upward trajectory highlights its resilience and strategic market positioning. As we look to the future, these trends offer valuable insights into the competitive dynamics of the technology sector.
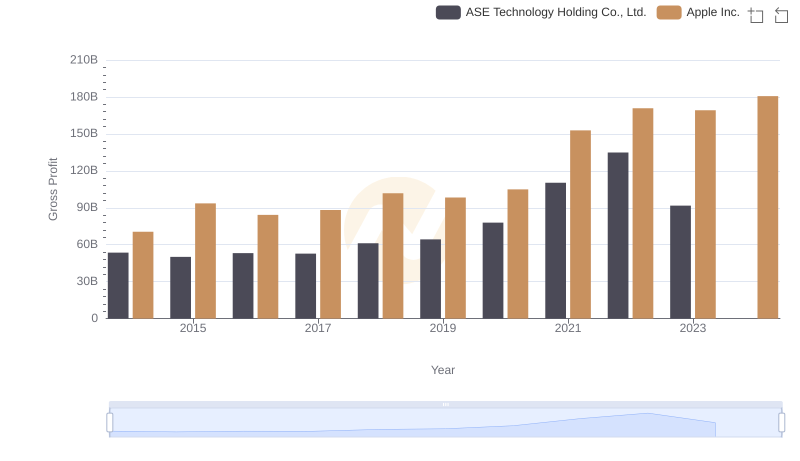
Apple Inc. vs ASE Technology Holding Co., Ltd.: A Gross Profit Performance Breakdown
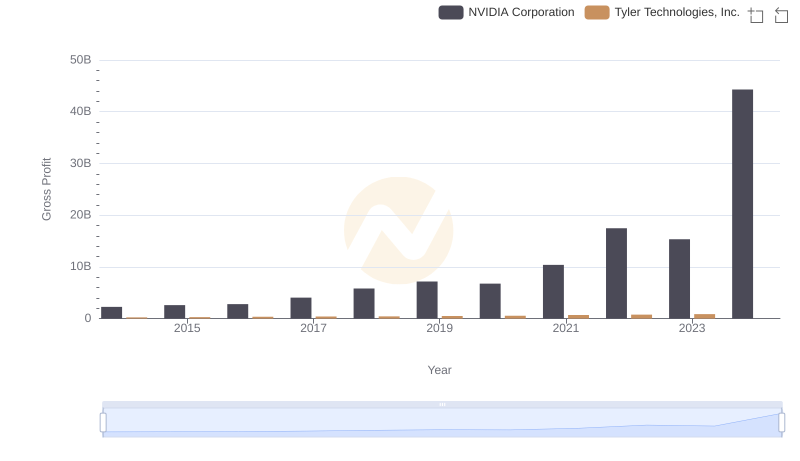
Gross Profit Comparison: NVIDIA Corporation and Tyler Technologies, Inc. Trends
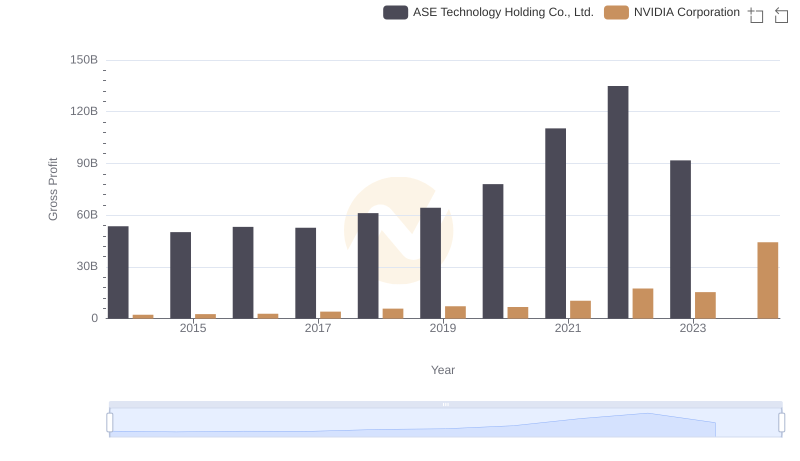
Key Insights on Gross Profit: NVIDIA Corporation vs ASE Technology Holding Co., Ltd.
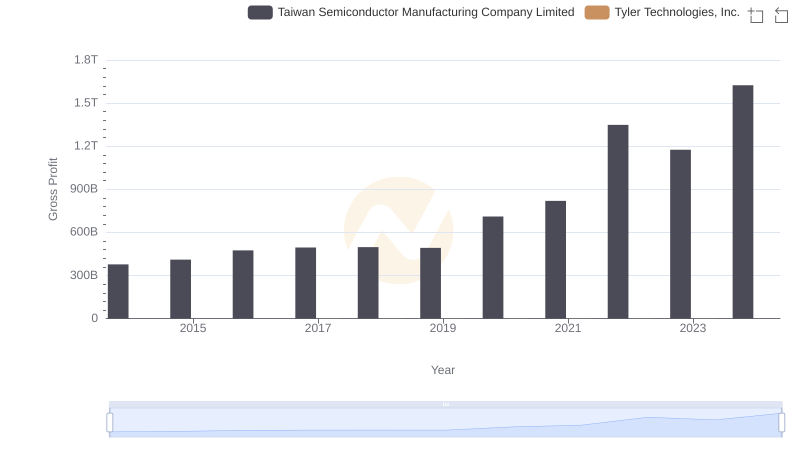
Key Insights on Gross Profit: Taiwan Semiconductor Manufacturing Company Limited vs Tyler Technologies, Inc.
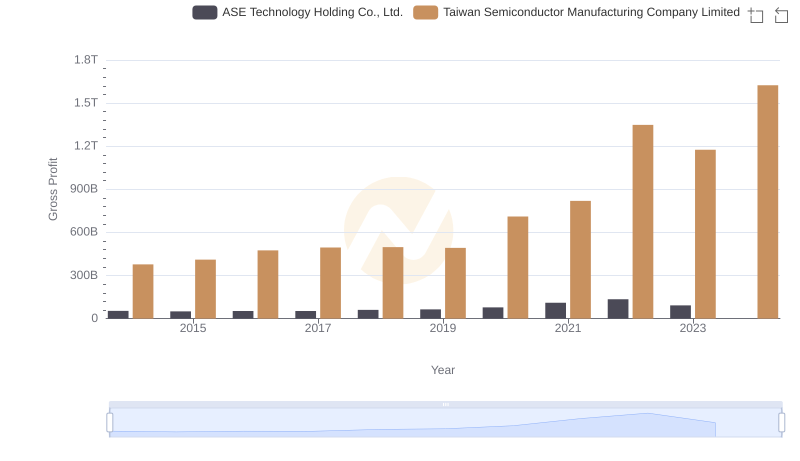
Taiwan Semiconductor Manufacturing Company Limited and ASE Technology Holding Co., Ltd.: A Detailed Gross Profit Analysis
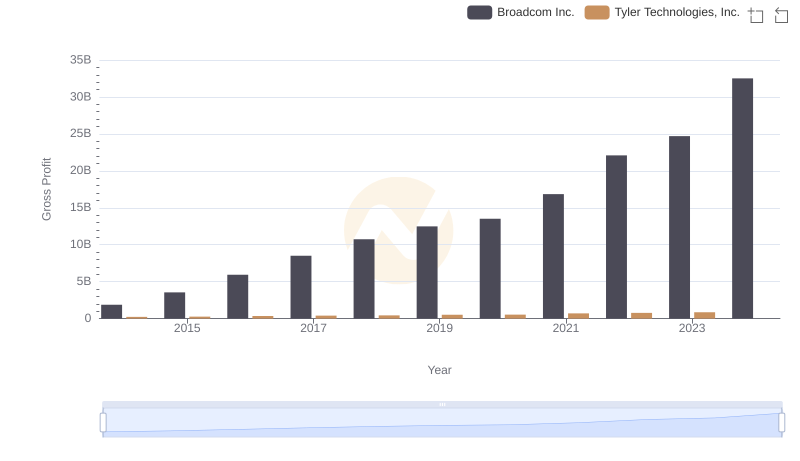
Gross Profit Trends Compared: Broadcom Inc. vs Tyler Technologies, Inc.
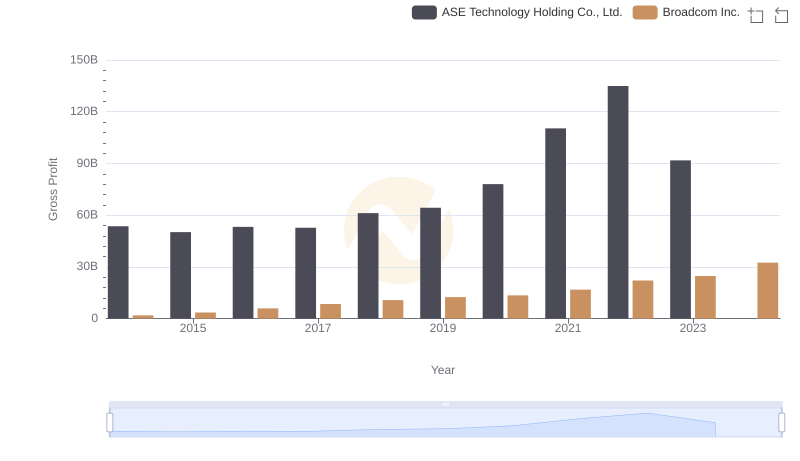
Who Generates Higher Gross Profit? Broadcom Inc. or ASE Technology Holding Co., Ltd.
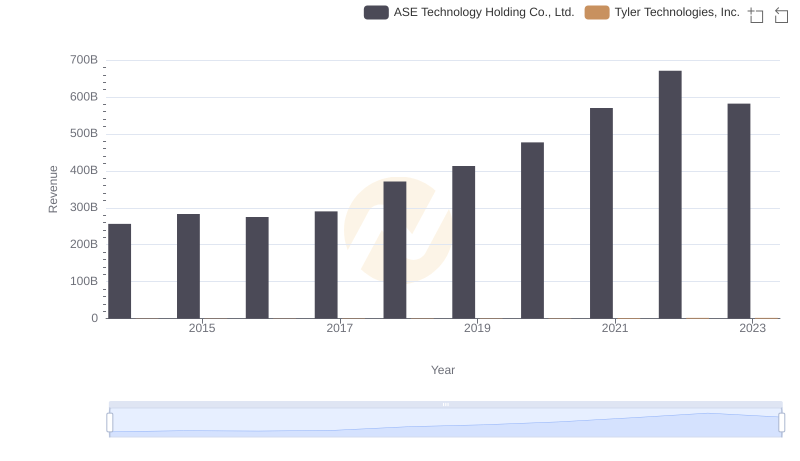
Who Generates More Revenue? Tyler Technologies, Inc. or ASE Technology Holding Co., Ltd.
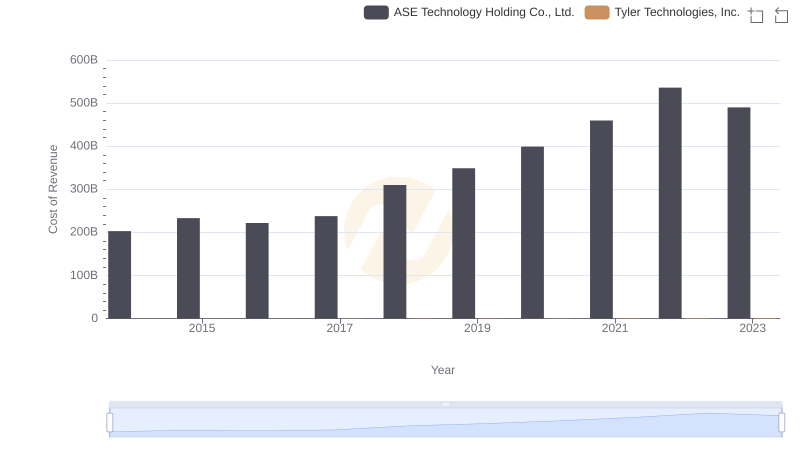
Cost of Revenue Trends: Tyler Technologies, Inc. vs ASE Technology Holding Co., Ltd.
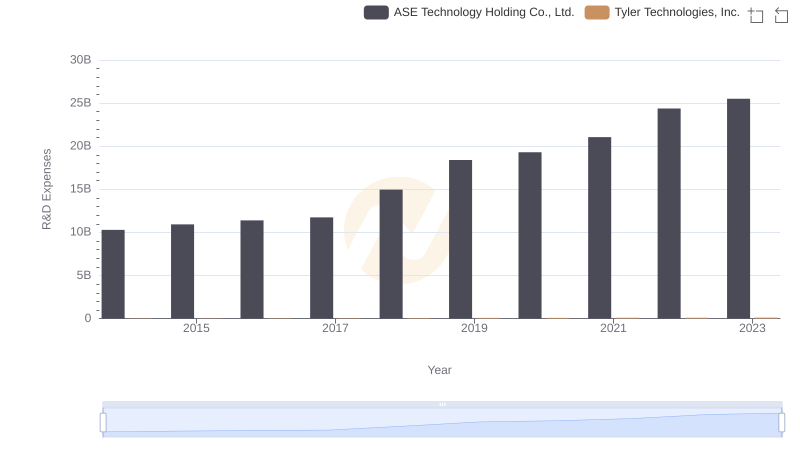
Research and Development Expenses Breakdown: Tyler Technologies, Inc. vs ASE Technology Holding Co., Ltd.
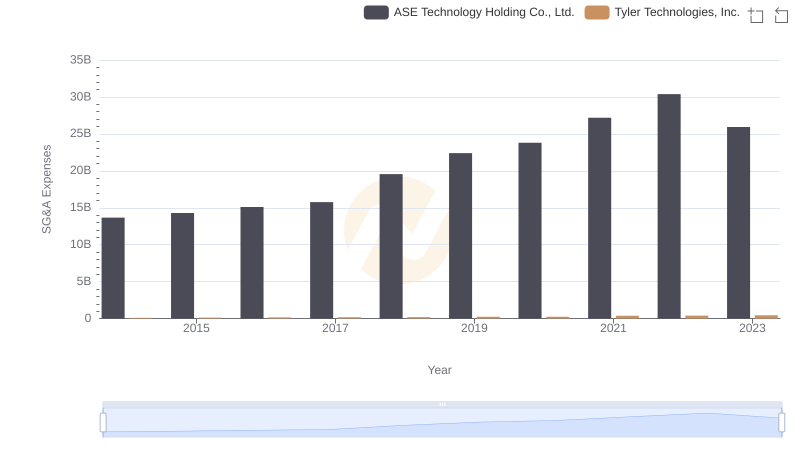
Cost Management Insights: SG&A Expenses for Tyler Technologies, Inc. and ASE Technology Holding Co., Ltd.
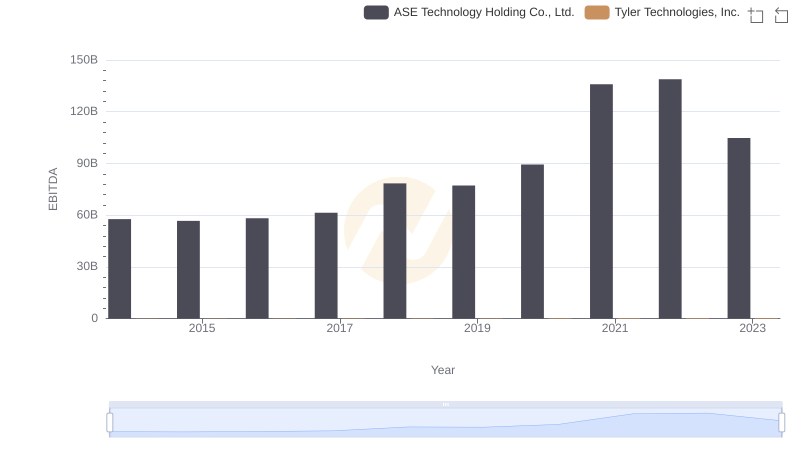
A Professional Review of EBITDA: Tyler Technologies, Inc. Compared to ASE Technology Holding Co., Ltd.