| __timestamp | ASE Technology Holding Co., Ltd. | Tyler Technologies, Inc. |
|---|---|---|
| Wednesday, January 1, 2014 | 203051000000 | 259730000 |
| Thursday, January 1, 2015 | 233153000000 | 313835000 |
| Friday, January 1, 2016 | 221690000000 | 400692000 |
| Sunday, January 1, 2017 | 237709000000 | 441522000 |
| Monday, January 1, 2018 | 309929000000 | 495704000 |
| Tuesday, January 1, 2019 | 348871000000 | 569527000 |
| Wednesday, January 1, 2020 | 398994000000 | 574151000 |
| Friday, January 1, 2021 | 459628000000 | 882643000 |
| Saturday, January 1, 2022 | 535943000000 | 1066341000 |
| Sunday, January 1, 2023 | 490157339000 | 1090652000 |
| Monday, January 1, 2024 | 499722880000 | 1202042000 |
Unleashing insights
In the ever-evolving landscape of technology, understanding cost dynamics is crucial. Tyler Technologies, Inc. and ASE Technology Holding Co., Ltd. offer a fascinating study in contrasts. From 2014 to 2023, ASE Technology's cost of revenue surged by approximately 141%, peaking in 2022. This reflects the company's aggressive expansion and scaling efforts in the semiconductor industry. Meanwhile, Tyler Technologies, a leader in public sector software, saw a more modest increase of around 320% over the same period, highlighting its steady growth and strategic investments.
These trends underscore the diverse strategies and market conditions faced by these industry giants.
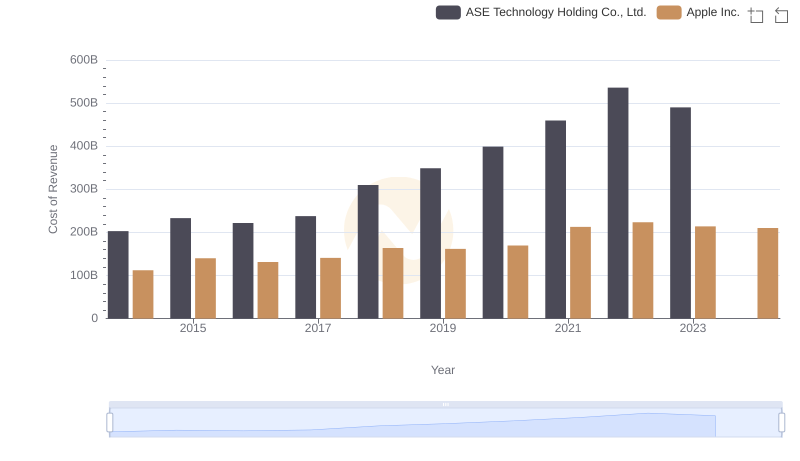
Comparing Cost of Revenue Efficiency: Apple Inc. vs ASE Technology Holding Co., Ltd.
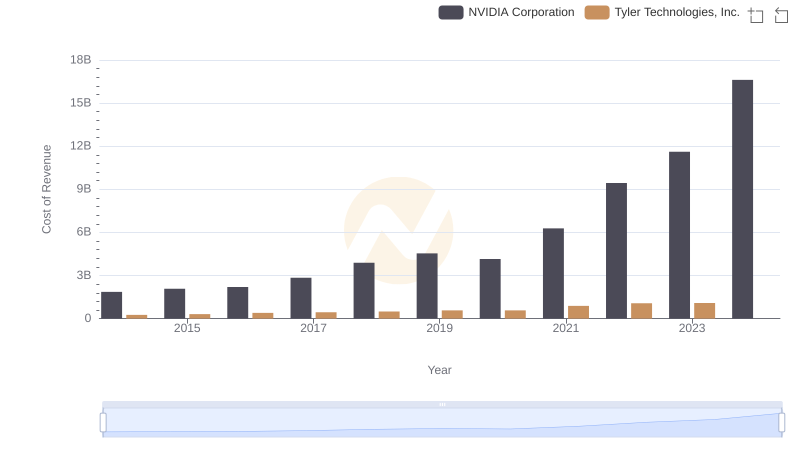
Analyzing Cost of Revenue: NVIDIA Corporation and Tyler Technologies, Inc.
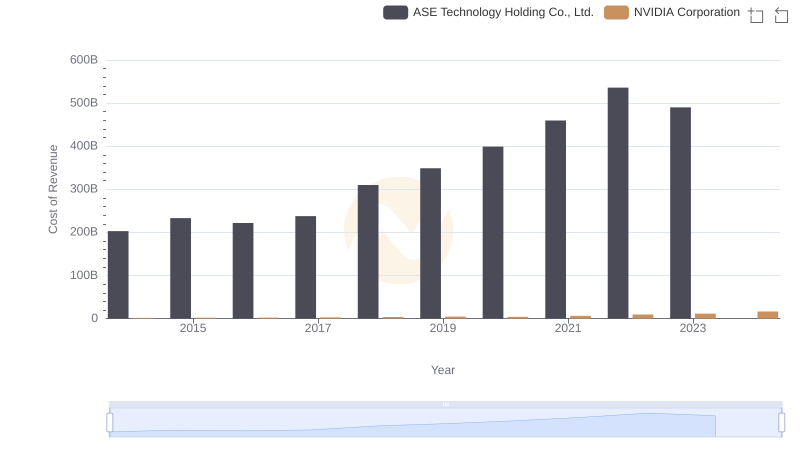
Analyzing Cost of Revenue: NVIDIA Corporation and ASE Technology Holding Co., Ltd.
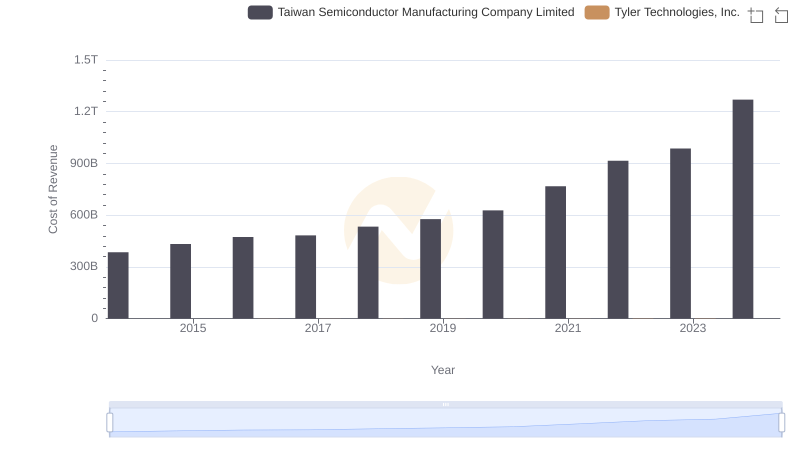
Cost of Revenue Comparison: Taiwan Semiconductor Manufacturing Company Limited vs Tyler Technologies, Inc.
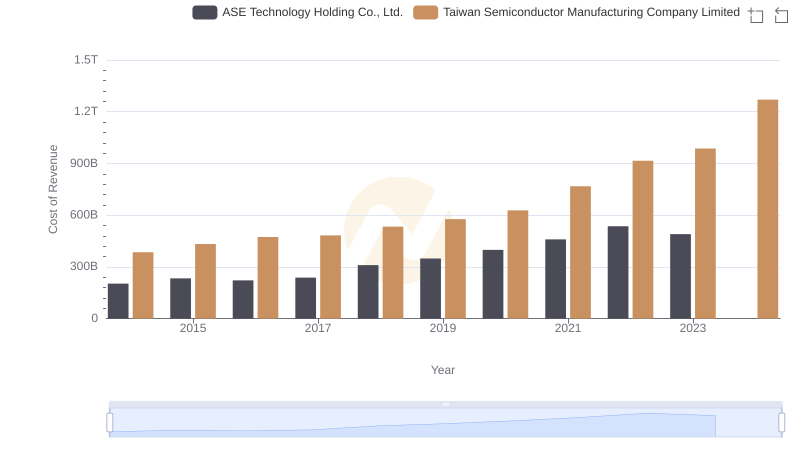
Cost Insights: Breaking Down Taiwan Semiconductor Manufacturing Company Limited and ASE Technology Holding Co., Ltd.'s Expenses
Cost of Revenue: Key Insights for Broadcom Inc. and Tyler Technologies, Inc.
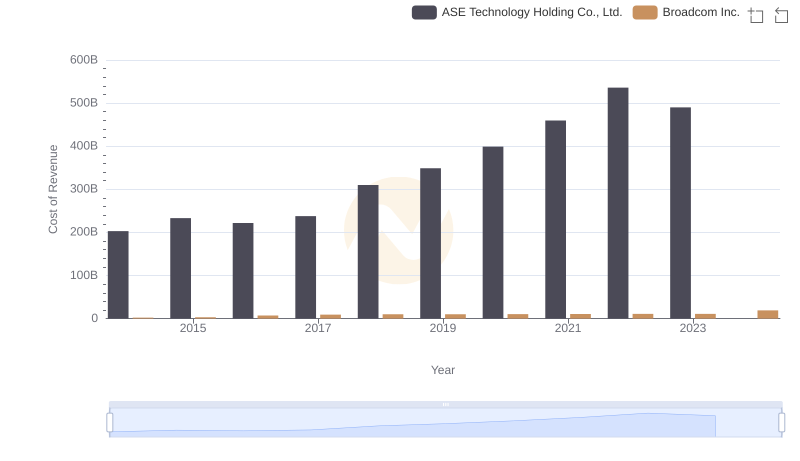
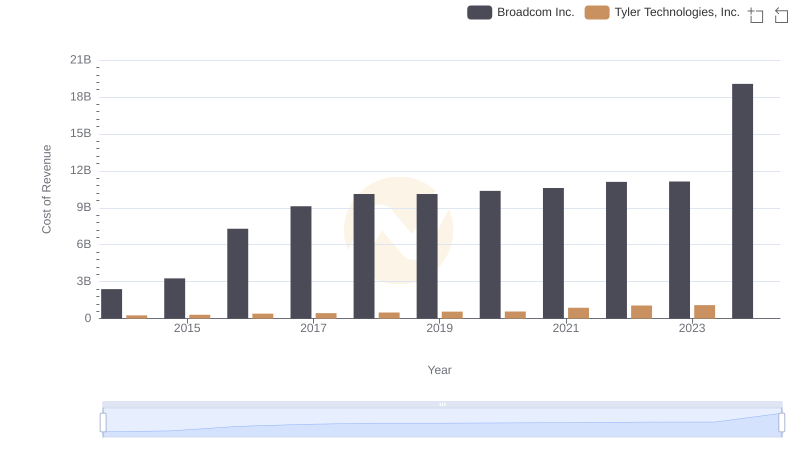
Analyzing Cost of Revenue: Broadcom Inc. and ASE Technology Holding Co., Ltd.
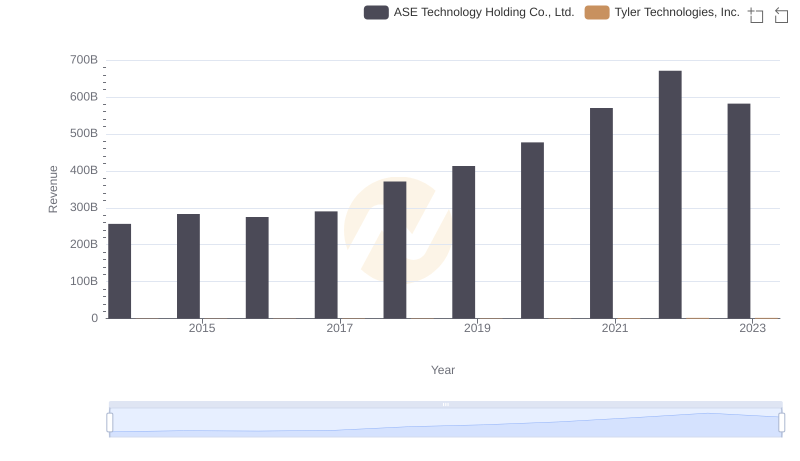
Who Generates More Revenue? Tyler Technologies, Inc. or ASE Technology Holding Co., Ltd.
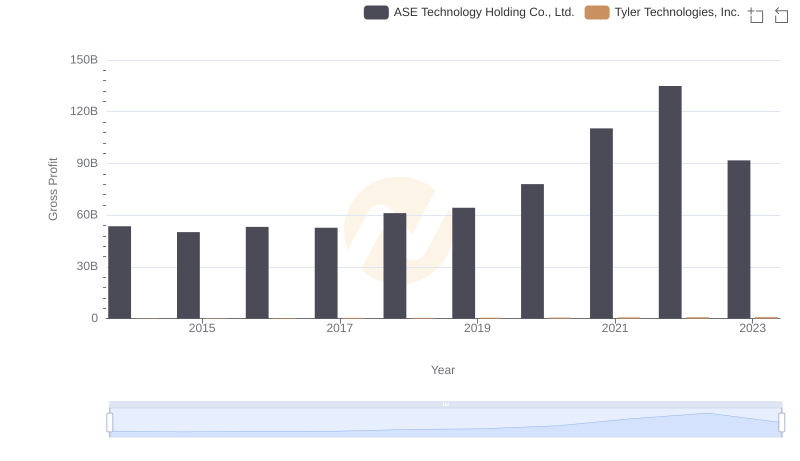
Tyler Technologies, Inc. vs ASE Technology Holding Co., Ltd.: A Gross Profit Performance Breakdown
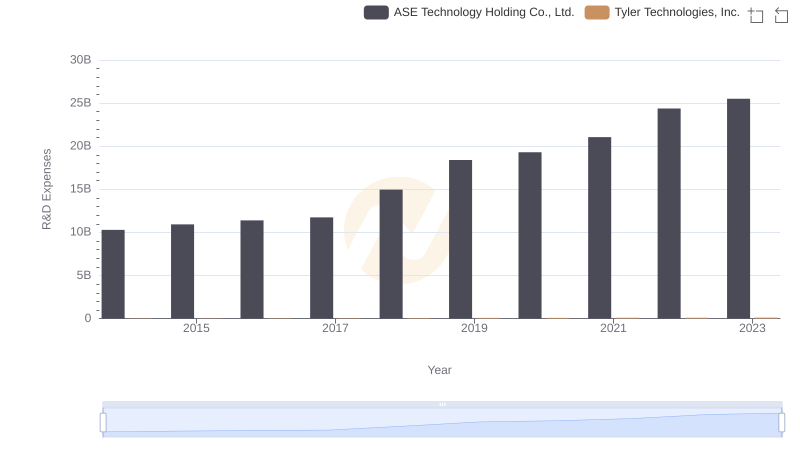
Research and Development Expenses Breakdown: Tyler Technologies, Inc. vs ASE Technology Holding Co., Ltd.
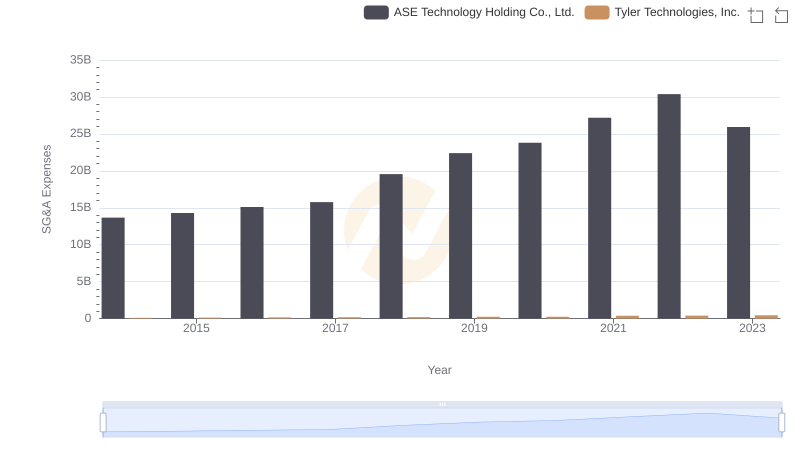
Cost Management Insights: SG&A Expenses for Tyler Technologies, Inc. and ASE Technology Holding Co., Ltd.
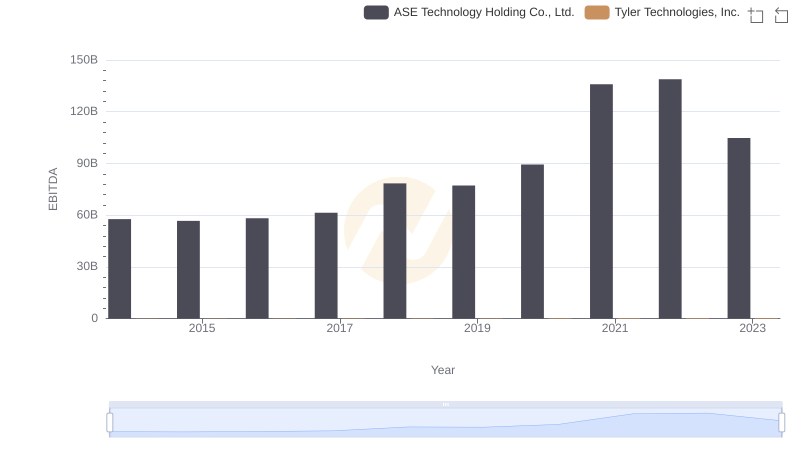
A Professional Review of EBITDA: Tyler Technologies, Inc. Compared to ASE Technology Holding Co., Ltd.