| __timestamp | ASE Technology Holding Co., Ltd. | Tyler Technologies, Inc. |
|---|---|---|
| Wednesday, January 1, 2014 | 13673000000 | 108260000 |
| Thursday, January 1, 2015 | 14295000000 | 133317000 |
| Friday, January 1, 2016 | 15099000000 | 167161000 |
| Sunday, January 1, 2017 | 15767000000 | 176974000 |
| Monday, January 1, 2018 | 19552000000 | 207605000 |
| Tuesday, January 1, 2019 | 22389000000 | 257746000 |
| Wednesday, January 1, 2020 | 23806000000 | 259561000 |
| Friday, January 1, 2021 | 27191000000 | 390579000 |
| Saturday, January 1, 2022 | 30384000000 | 403067000 |
| Sunday, January 1, 2023 | 25930017000 | 458345000 |
| Monday, January 1, 2024 | 27353513000 | 458669000 |
Infusing magic into the data realm
In the ever-evolving landscape of corporate finance, understanding Selling, General, and Administrative (SG&A) expenses is crucial for effective cost management. This analysis delves into the SG&A trends of Tyler Technologies, Inc. and ASE Technology Holding Co., Ltd. over the past decade, from 2014 to 2023.
Tyler Technologies has demonstrated a steady increase in SG&A expenses, growing by approximately 323% from 2014 to 2023. This growth reflects the company's strategic investments in expanding its market presence and enhancing operational capabilities.
Conversely, ASE Technology Holding Co., Ltd. experienced a more volatile trajectory, with a peak in 2022, marking a 122% increase from 2014. However, a slight decline in 2023 suggests a shift towards optimizing operational efficiencies.
These insights underscore the importance of strategic cost management in navigating the complexities of global markets.
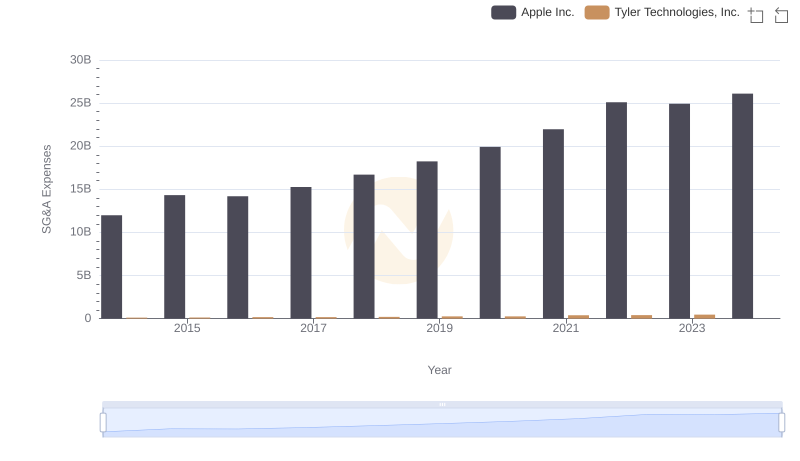
Operational Costs Compared: SG&A Analysis of Apple Inc. and Tyler Technologies, Inc.
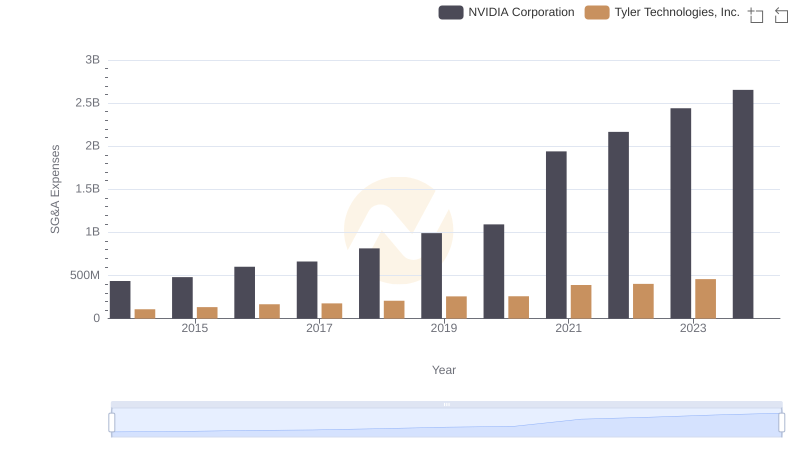
Comparing SG&A Expenses: NVIDIA Corporation vs Tyler Technologies, Inc. Trends and Insights
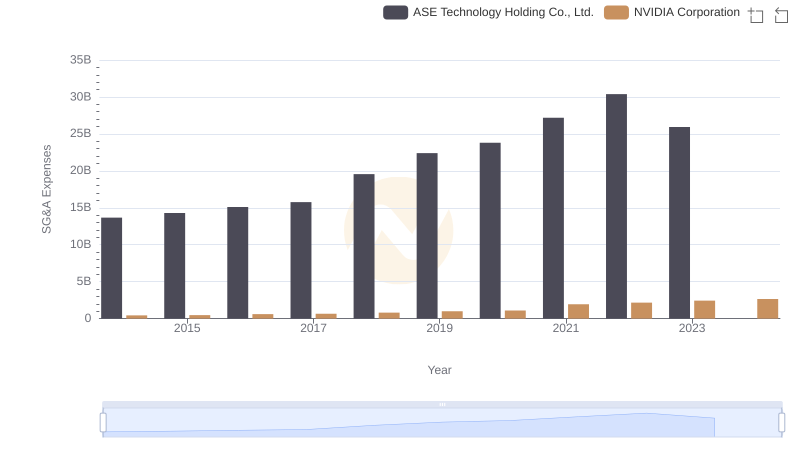
Operational Costs Compared: SG&A Analysis of NVIDIA Corporation and ASE Technology Holding Co., Ltd.
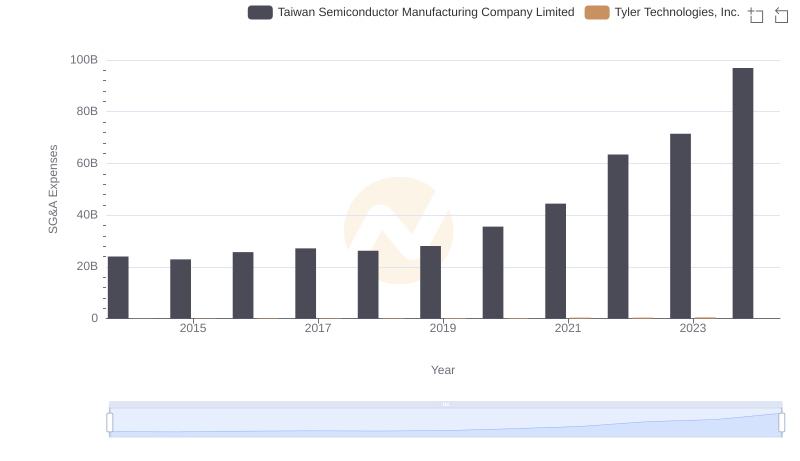
SG&A Efficiency Analysis: Comparing Taiwan Semiconductor Manufacturing Company Limited and Tyler Technologies, Inc.
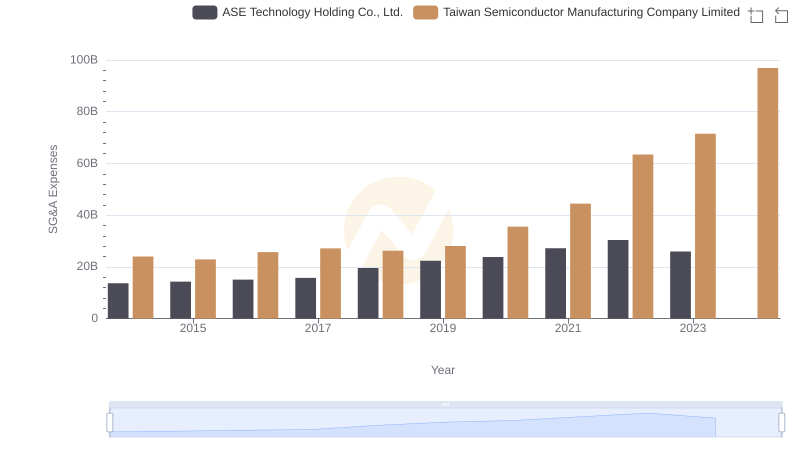
Who Optimizes SG&A Costs Better? Taiwan Semiconductor Manufacturing Company Limited or ASE Technology Holding Co., Ltd.
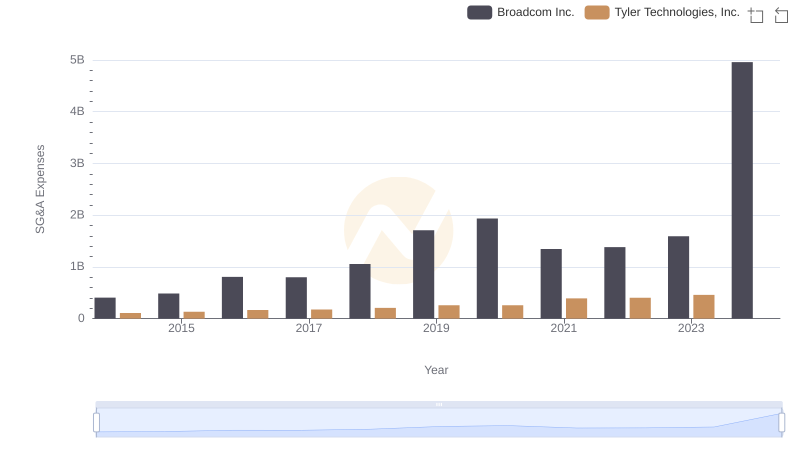
Cost Management Insights: SG&A Expenses for Broadcom Inc. and Tyler Technologies, Inc.
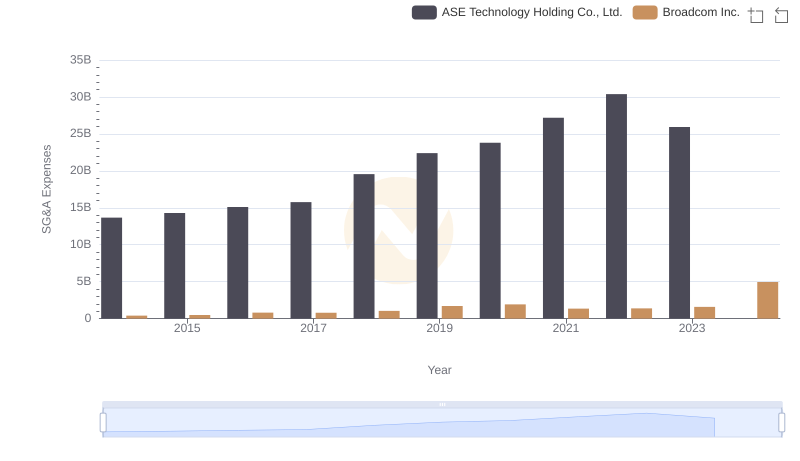
Breaking Down SG&A Expenses: Broadcom Inc. vs ASE Technology Holding Co., Ltd.
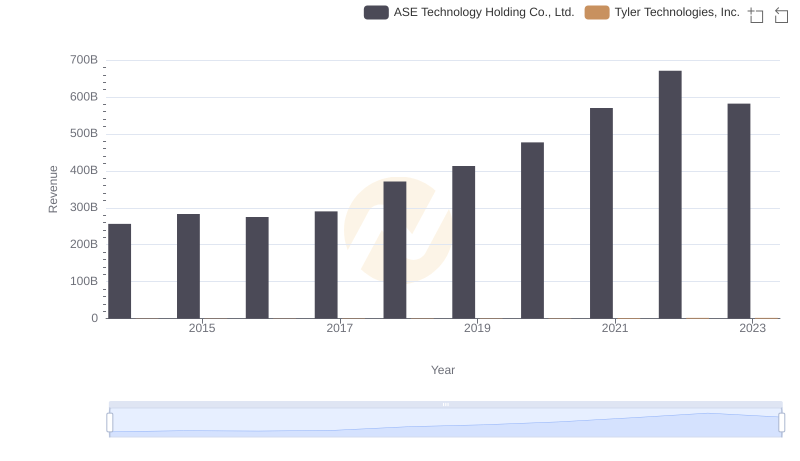
Who Generates More Revenue? Tyler Technologies, Inc. or ASE Technology Holding Co., Ltd.
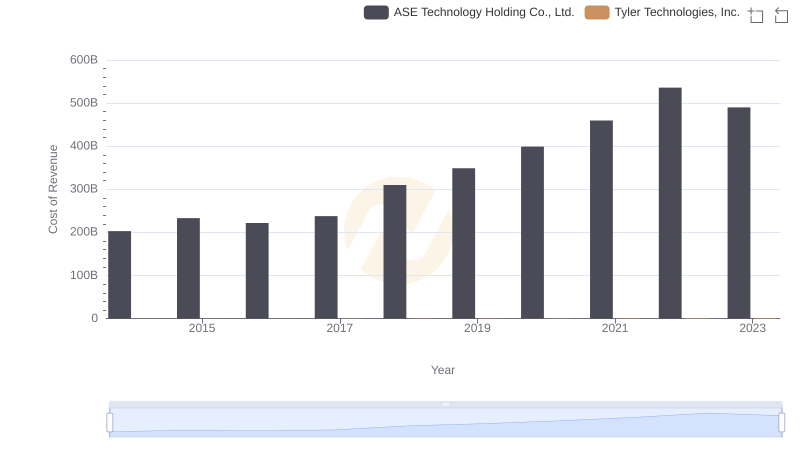
Cost of Revenue Trends: Tyler Technologies, Inc. vs ASE Technology Holding Co., Ltd.
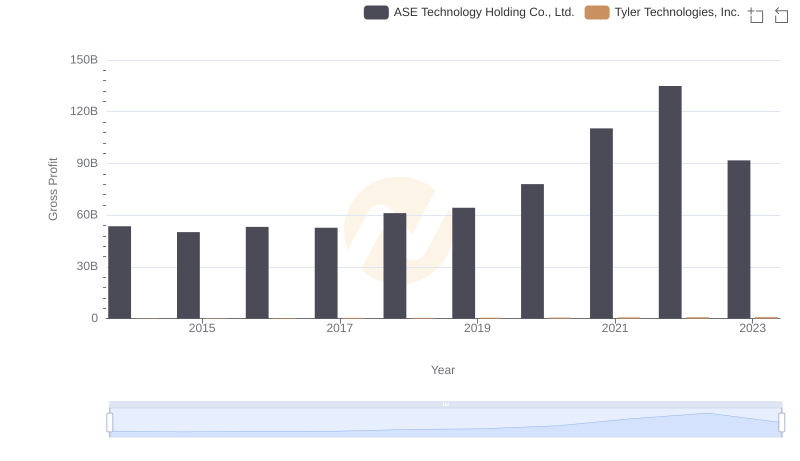
Tyler Technologies, Inc. vs ASE Technology Holding Co., Ltd.: A Gross Profit Performance Breakdown
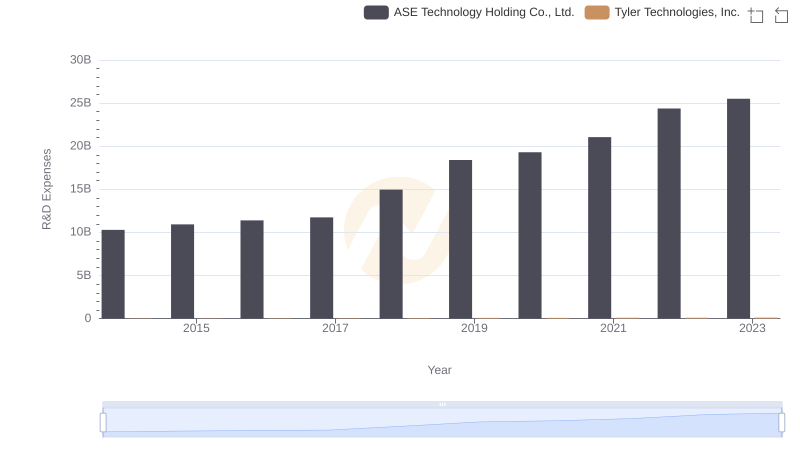
Research and Development Expenses Breakdown: Tyler Technologies, Inc. vs ASE Technology Holding Co., Ltd.
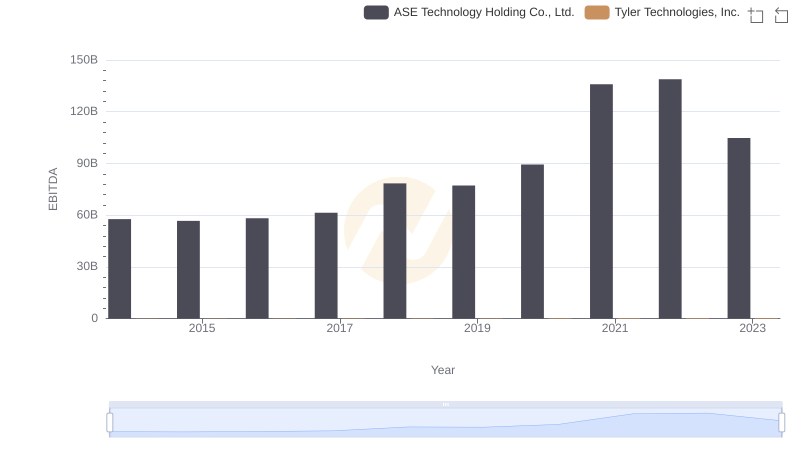
A Professional Review of EBITDA: Tyler Technologies, Inc. Compared to ASE Technology Holding Co., Ltd.