| __timestamp | ASE Technology Holding Co., Ltd. | Tyler Technologies, Inc. |
|---|---|---|
| Wednesday, January 1, 2014 | 57728376000 | 109427000 |
| Thursday, January 1, 2015 | 56716330000 | 127617000 |
| Friday, January 1, 2016 | 58196307000 | 165194000 |
| Sunday, January 1, 2017 | 61377328000 | 194467000 |
| Monday, January 1, 2018 | 78432873000 | 191279000 |
| Tuesday, January 1, 2019 | 77173662000 | 233039000 |
| Wednesday, January 1, 2020 | 89377502000 | 254583000 |
| Friday, January 1, 2021 | 135966088000 | 328119000 |
| Saturday, January 1, 2022 | 138852591000 | 388013000 |
| Sunday, January 1, 2023 | 104757657000 | 392632000 |
| Monday, January 1, 2024 | 104735170000 | 299526000 |
Infusing magic into the data realm
In the ever-evolving landscape of technology, understanding financial health is crucial. This analysis delves into the EBITDA performance of Tyler Technologies, Inc. and ASE Technology Holding Co., Ltd. from 2014 to 2023. Over this period, ASE Technology has demonstrated a robust growth trajectory, with its EBITDA increasing by approximately 82%, peaking in 2022. In contrast, Tyler Technologies, while smaller in scale, has shown a consistent upward trend, with a remarkable 259% growth over the same period.
This comparative analysis underscores the diverse strategies and market positions of these two tech giants, offering valuable insights for investors and industry enthusiasts alike.
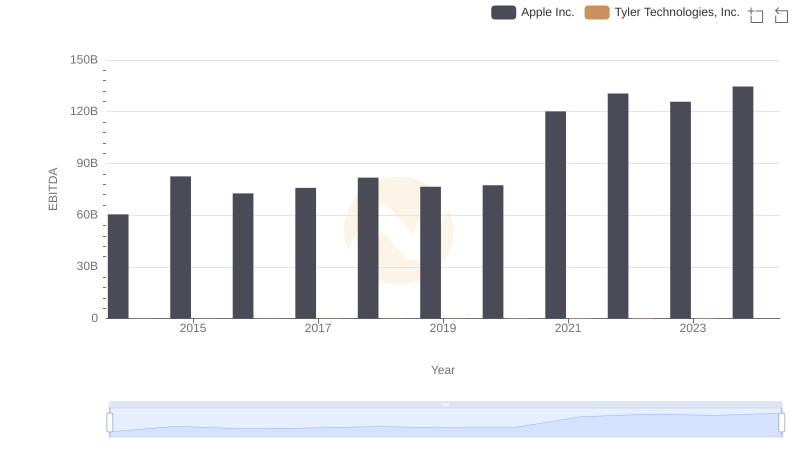
A Side-by-Side Analysis of EBITDA: Apple Inc. and Tyler Technologies, Inc.
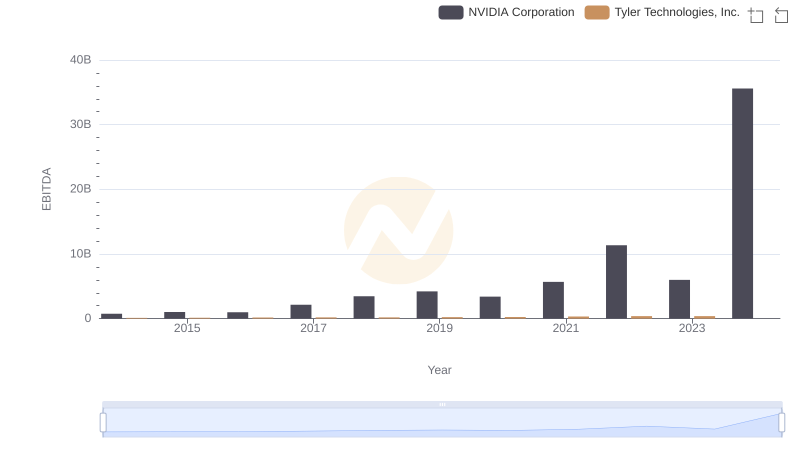
Comparative EBITDA Analysis: NVIDIA Corporation vs Tyler Technologies, Inc.
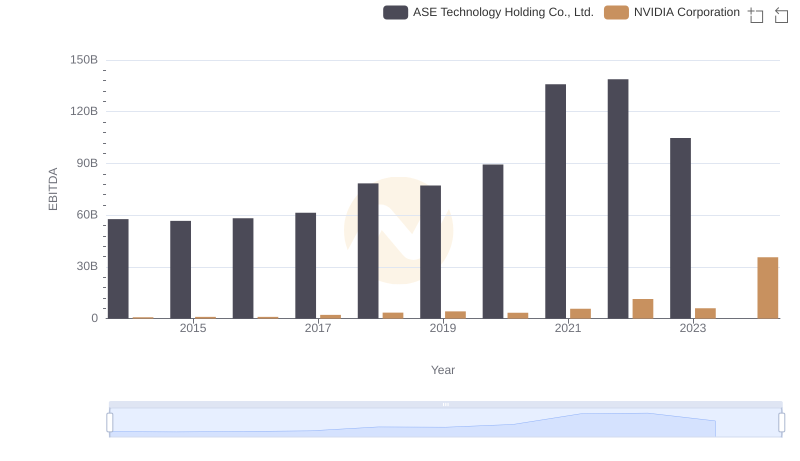
Comparative EBITDA Analysis: NVIDIA Corporation vs ASE Technology Holding Co., Ltd.
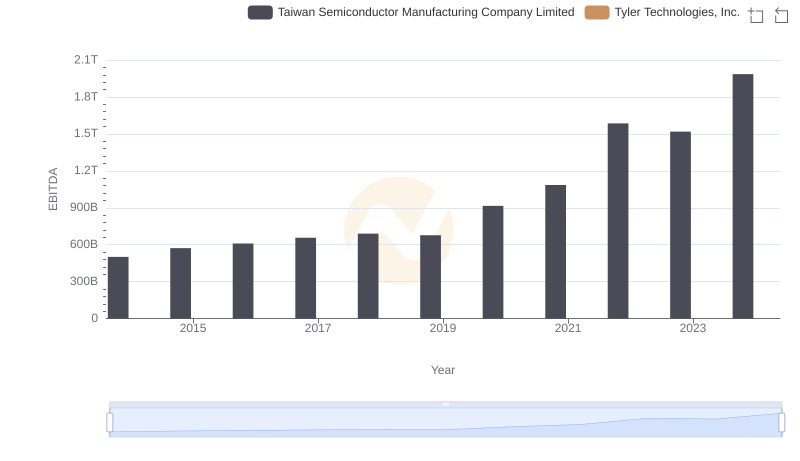
EBITDA Performance Review: Taiwan Semiconductor Manufacturing Company Limited vs Tyler Technologies, Inc.
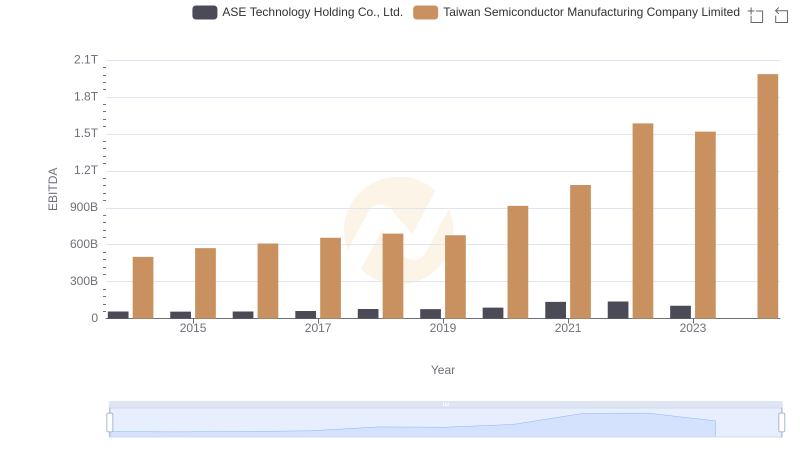
EBITDA Performance Review: Taiwan Semiconductor Manufacturing Company Limited vs ASE Technology Holding Co., Ltd.
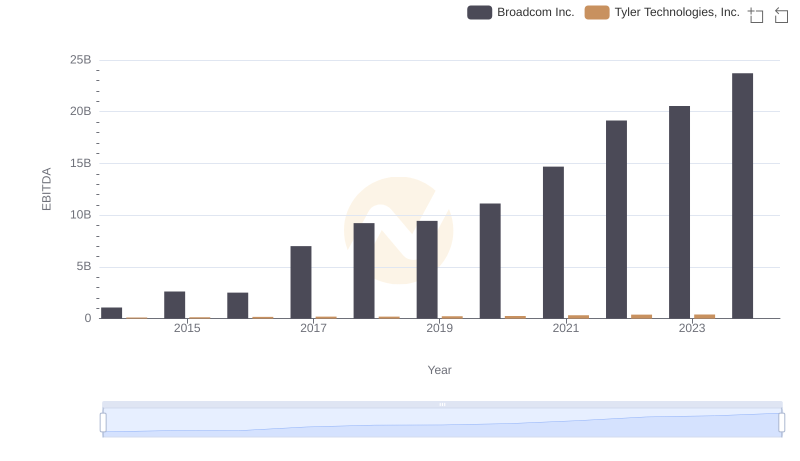
EBITDA Performance Review: Broadcom Inc. vs Tyler Technologies, Inc.
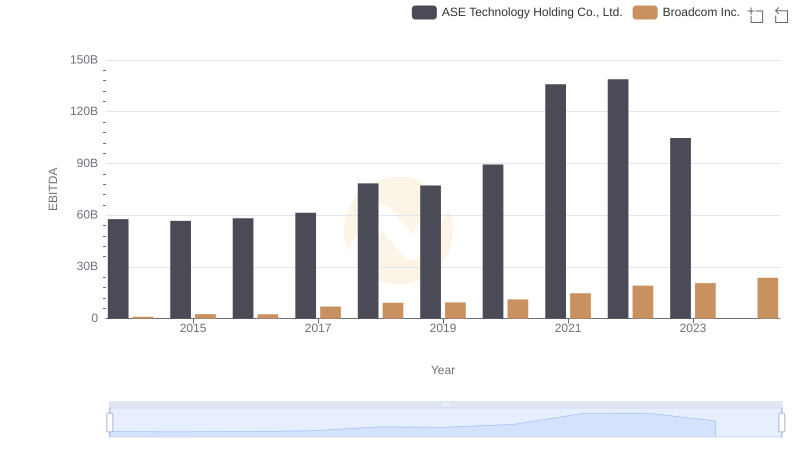
Professional EBITDA Benchmarking: Broadcom Inc. vs ASE Technology Holding Co., Ltd.
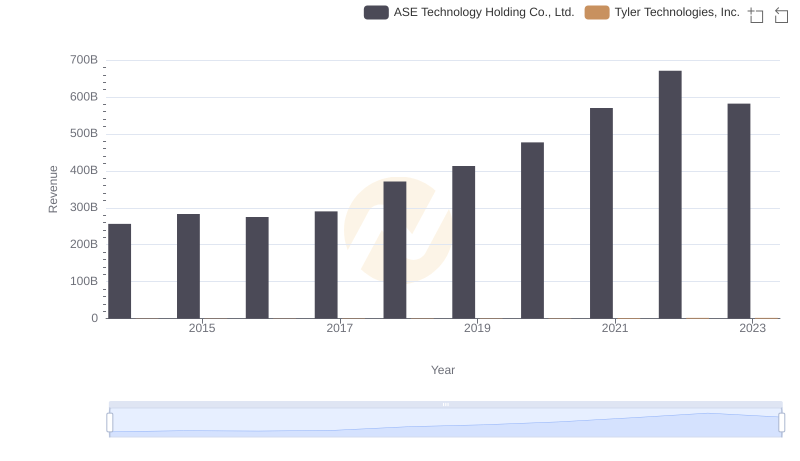
Who Generates More Revenue? Tyler Technologies, Inc. or ASE Technology Holding Co., Ltd.
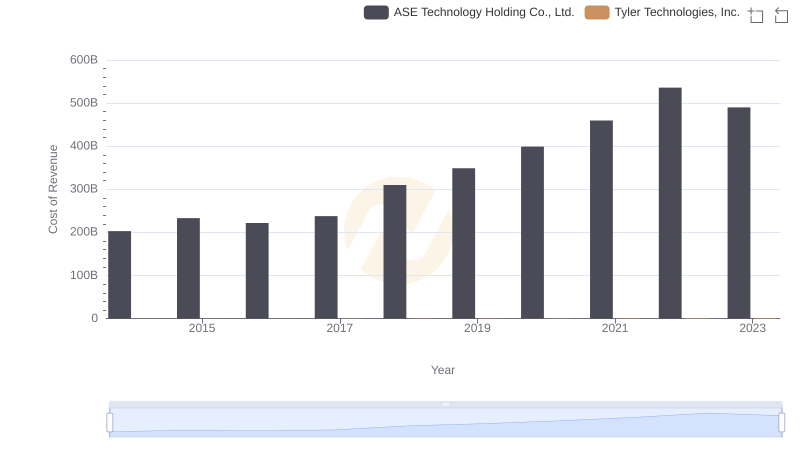
Cost of Revenue Trends: Tyler Technologies, Inc. vs ASE Technology Holding Co., Ltd.
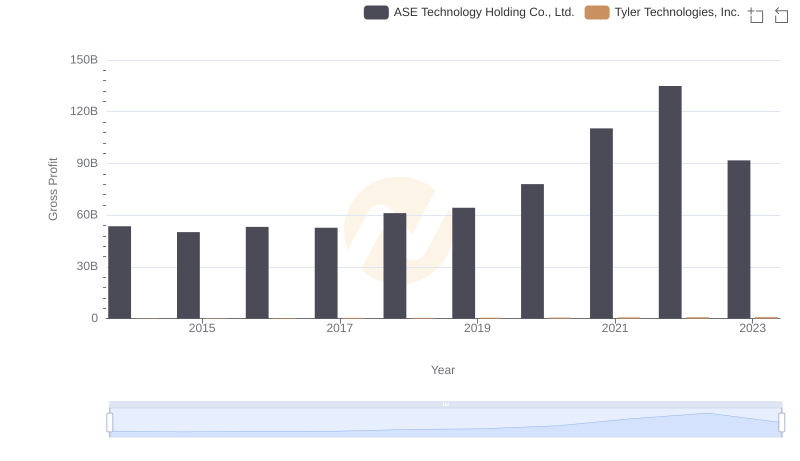
Tyler Technologies, Inc. vs ASE Technology Holding Co., Ltd.: A Gross Profit Performance Breakdown
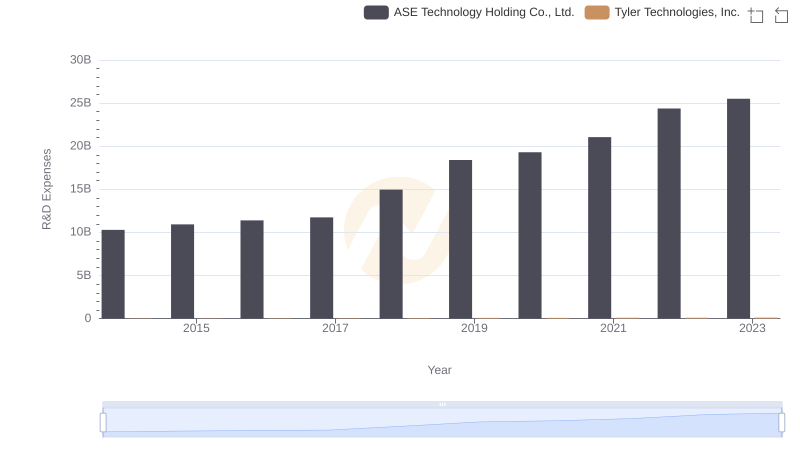
Research and Development Expenses Breakdown: Tyler Technologies, Inc. vs ASE Technology Holding Co., Ltd.
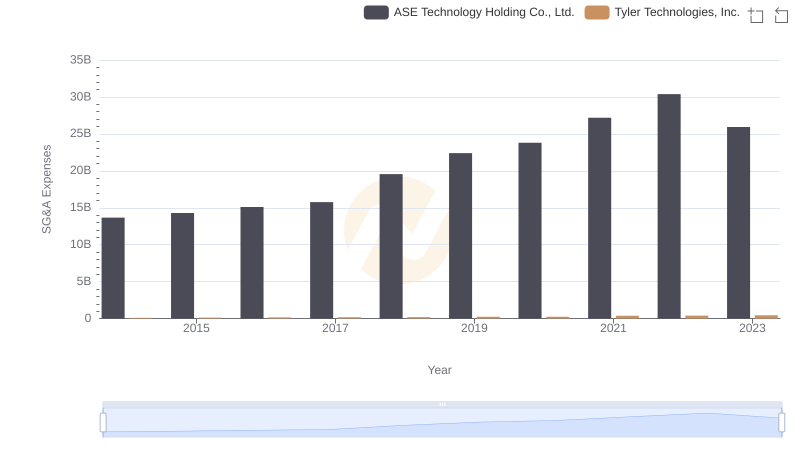
Cost Management Insights: SG&A Expenses for Tyler Technologies, Inc. and ASE Technology Holding Co., Ltd.