| __timestamp | ASE Technology Holding Co., Ltd. | Tyler Technologies, Inc. |
|---|---|---|
| Wednesday, January 1, 2014 | 10296000000 | 25743000 |
| Thursday, January 1, 2015 | 10928000000 | 29922000 |
| Friday, January 1, 2016 | 11391000000 | 43154000 |
| Sunday, January 1, 2017 | 11747000000 | 47324000 |
| Monday, January 1, 2018 | 14963000000 | 63264000 |
| Tuesday, January 1, 2019 | 18396000000 | 81342000 |
| Wednesday, January 1, 2020 | 19301000000 | 88363000 |
| Friday, January 1, 2021 | 21053000000 | 93481000 |
| Saturday, January 1, 2022 | 24370000000 | 105184000 |
| Sunday, January 1, 2023 | 25499408000 | 109585000 |
| Monday, January 1, 2024 | 28829912000 | 117939000 |
Data in motion
In the ever-evolving tech landscape, research and development (R&D) expenses are a key indicator of a company's commitment to innovation. Tyler Technologies, Inc. and ASE Technology Holding Co., Ltd. exemplify contrasting approaches in this arena. Over the past decade, ASE Technology has consistently outpaced Tyler Technologies in R&D spending, with a staggering 1,500% higher investment on average. From 2014 to 2023, ASE Technology's R&D expenses surged by 148%, reflecting its aggressive pursuit of technological advancements. Meanwhile, Tyler Technologies demonstrated a steady growth trajectory, increasing its R&D budget by 325% during the same period. This divergence highlights the strategic priorities of each company: ASE Technology's focus on large-scale innovation versus Tyler Technologies' targeted, incremental improvements. As we look to the future, these spending patterns may well shape the competitive dynamics in their respective markets.
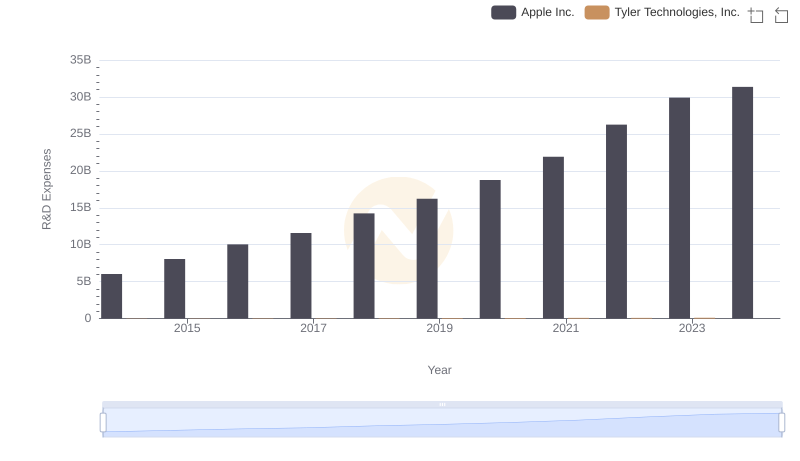
Research and Development Investment: Apple Inc. vs Tyler Technologies, Inc.
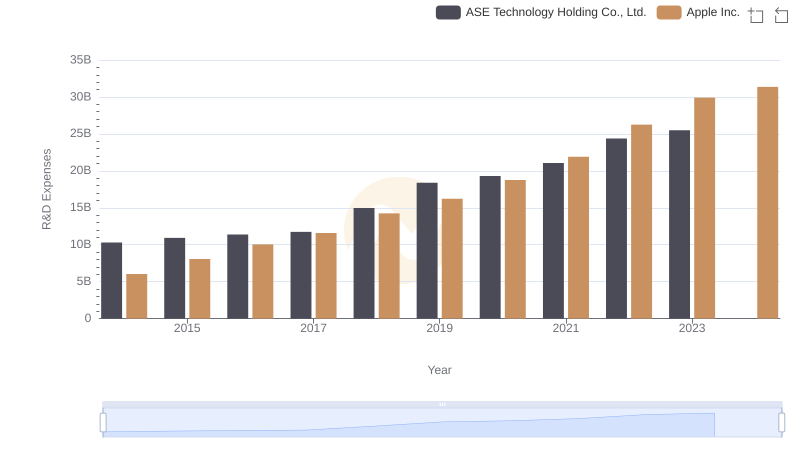
Research and Development: Comparing Key Metrics for Apple Inc. and ASE Technology Holding Co., Ltd.
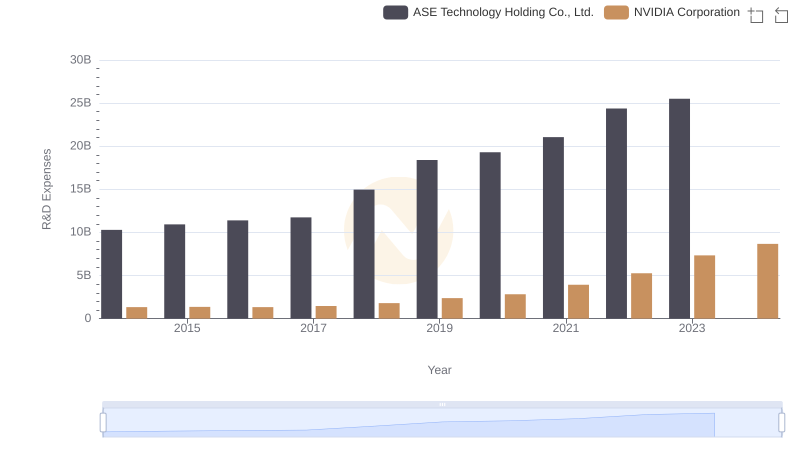
Research and Development Investment: NVIDIA Corporation vs ASE Technology Holding Co., Ltd.
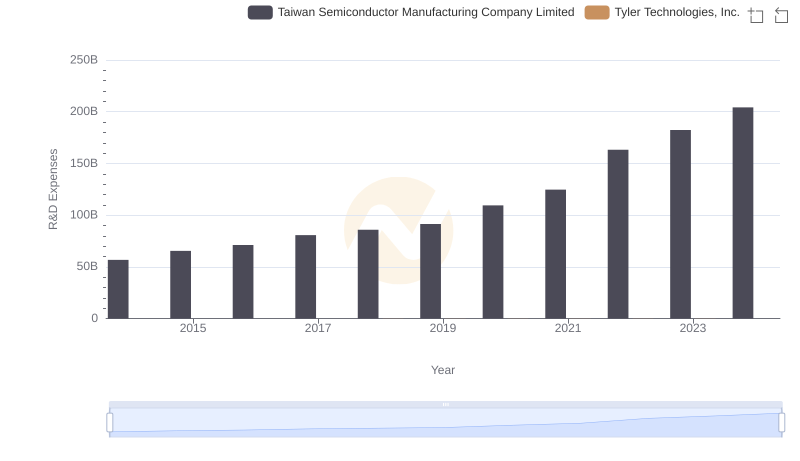
Research and Development Expenses Breakdown: Taiwan Semiconductor Manufacturing Company Limited vs Tyler Technologies, Inc.
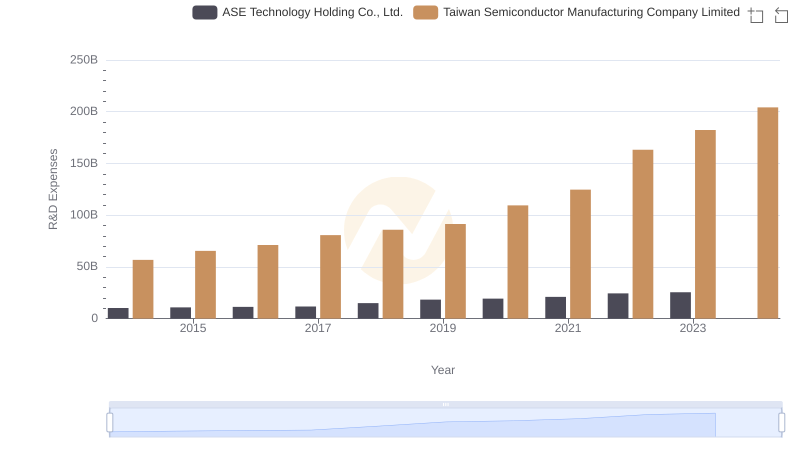
Research and Development Expenses Breakdown: Taiwan Semiconductor Manufacturing Company Limited vs ASE Technology Holding Co., Ltd.
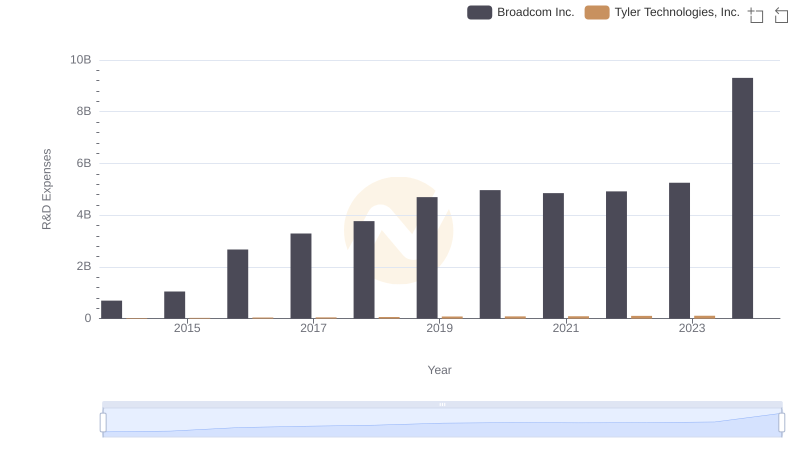
R&D Spending Showdown: Broadcom Inc. vs Tyler Technologies, Inc.
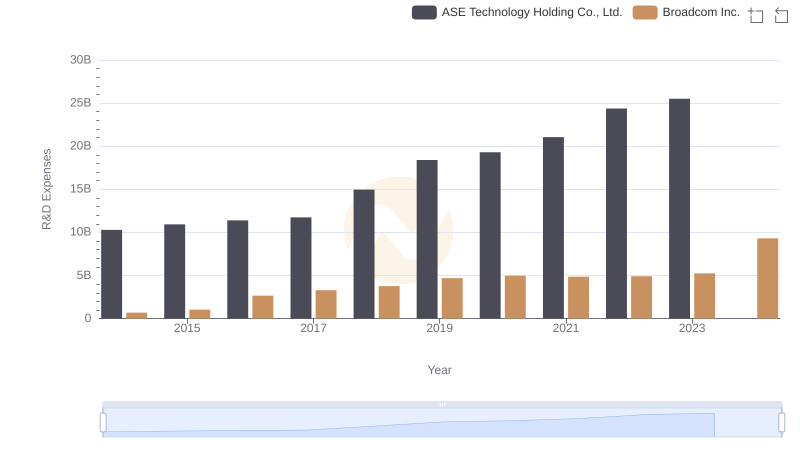
R&D Spending Showdown: Broadcom Inc. vs ASE Technology Holding Co., Ltd.
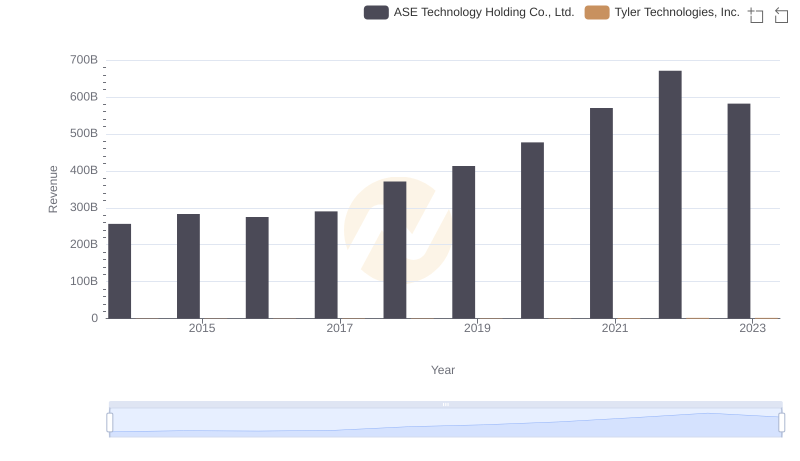
Who Generates More Revenue? Tyler Technologies, Inc. or ASE Technology Holding Co., Ltd.
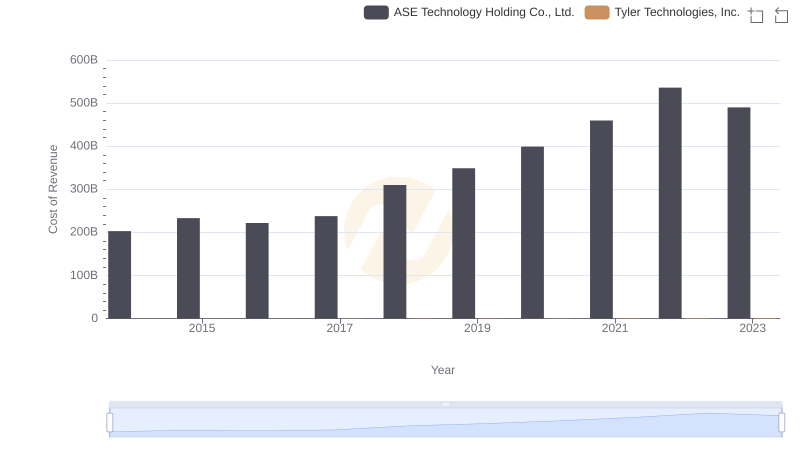
Cost of Revenue Trends: Tyler Technologies, Inc. vs ASE Technology Holding Co., Ltd.
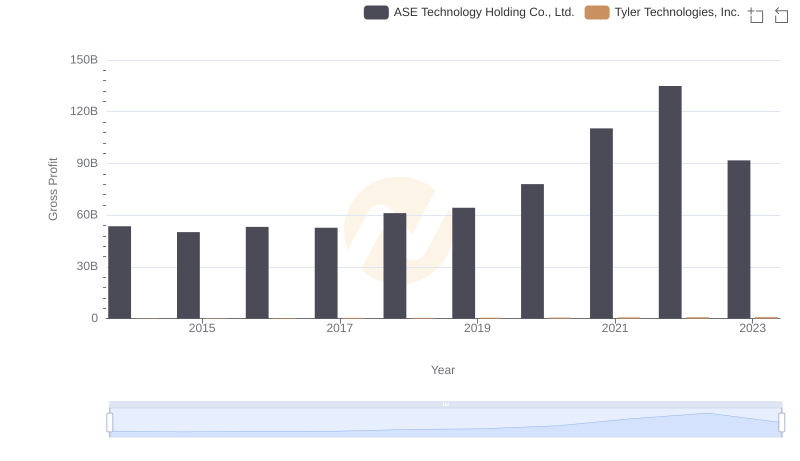
Tyler Technologies, Inc. vs ASE Technology Holding Co., Ltd.: A Gross Profit Performance Breakdown
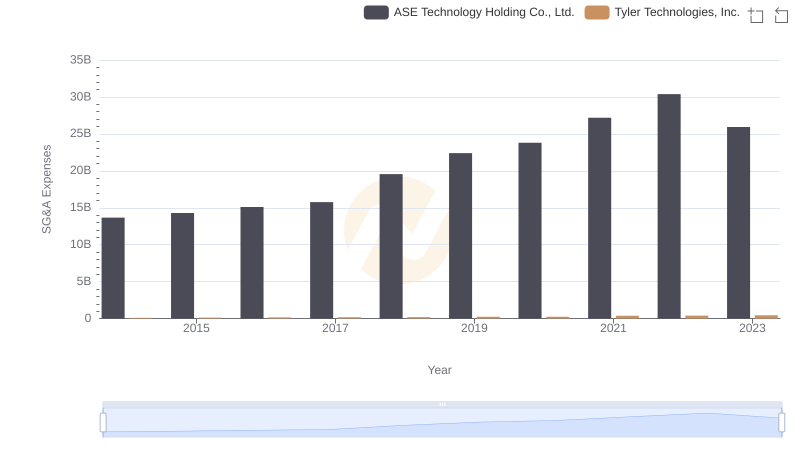
Cost Management Insights: SG&A Expenses for Tyler Technologies, Inc. and ASE Technology Holding Co., Ltd.
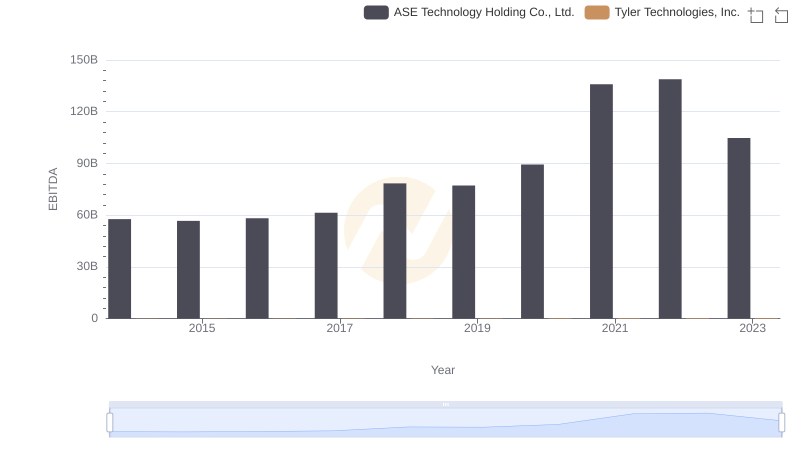
A Professional Review of EBITDA: Tyler Technologies, Inc. Compared to ASE Technology Holding Co., Ltd.