| __timestamp | Lennox International Inc. | Union Pacific Corporation |
|---|---|---|
| Wednesday, January 1, 2014 | 903300000 | 9677000000 |
| Thursday, January 1, 2015 | 947400000 | 8976000000 |
| Friday, January 1, 2016 | 1076500000 | 8269000000 |
| Sunday, January 1, 2017 | 1125200000 | 9009000000 |
| Monday, January 1, 2018 | 1111200000 | 9539000000 |
| Tuesday, January 1, 2019 | 1079800000 | 9614000000 |
| Wednesday, January 1, 2020 | 1040100000 | 9179000000 |
| Friday, January 1, 2021 | 1188400000 | 10514000000 |
| Saturday, January 1, 2022 | 1284700000 | 11205000000 |
| Sunday, January 1, 2023 | 1547800000 | 10529000000 |
| Monday, January 1, 2024 | 1771900000 | 11039000000 |
Unleashing the power of data
In the world of American industry, Union Pacific Corporation and Lennox International Inc. stand as titans in their respective fields. Over the past decade, from 2014 to 2024, these companies have showcased their prowess in generating gross profit. Union Pacific, a leader in the railroad industry, consistently outperformed Lennox, a key player in climate control solutions, with gross profits averaging nearly 10 times higher.
Union Pacific's gross profit peaked in 2022, reaching a staggering 11.2 billion, while Lennox saw its highest in 2024 with 1.77 billion. Despite Lennox's impressive growth, Union Pacific's dominance remains unchallenged. This comparison highlights the scale and impact of these industries on the U.S. economy, with Union Pacific's railroads playing a crucial role in national logistics and Lennox's innovations driving comfort in homes and businesses.
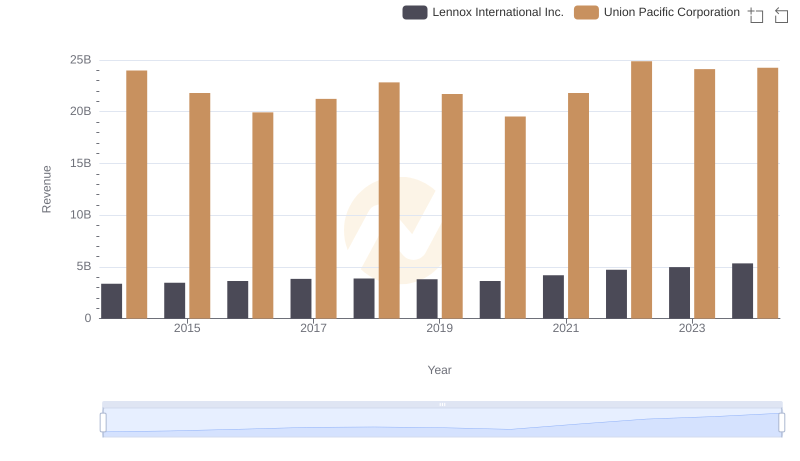
Breaking Down Revenue Trends: Union Pacific Corporation vs Lennox International Inc.
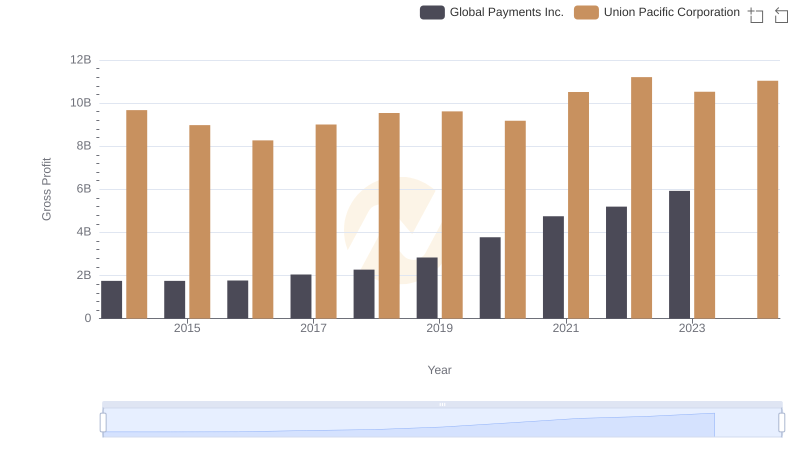
Gross Profit Comparison: Union Pacific Corporation and Global Payments Inc. Trends
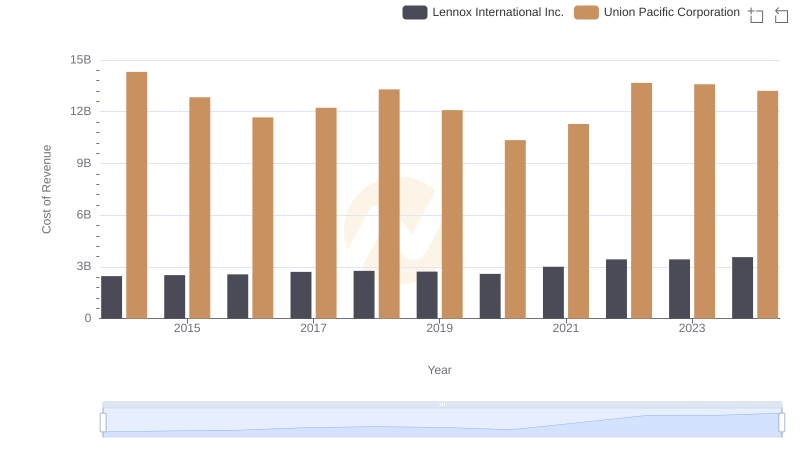
Union Pacific Corporation vs Lennox International Inc.: Efficiency in Cost of Revenue Explored
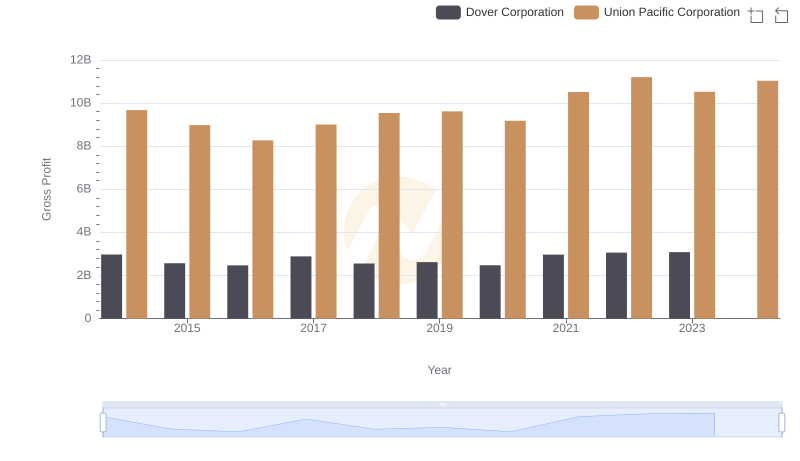
Gross Profit Trends Compared: Union Pacific Corporation vs Dover Corporation
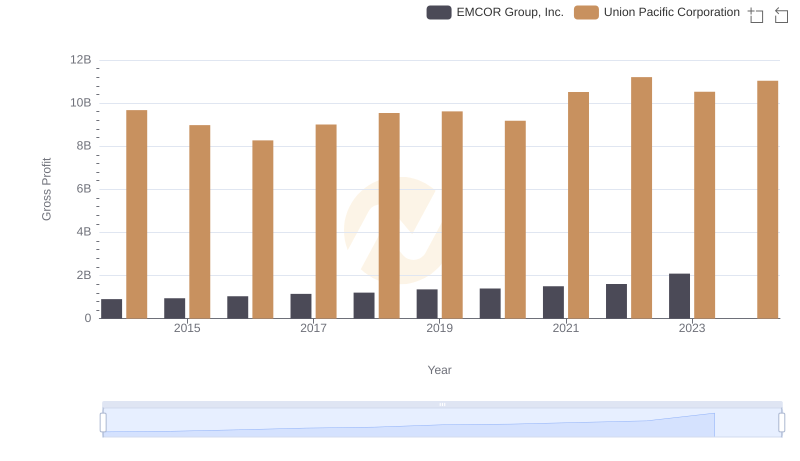
Union Pacific Corporation vs EMCOR Group, Inc.: A Gross Profit Performance Breakdown
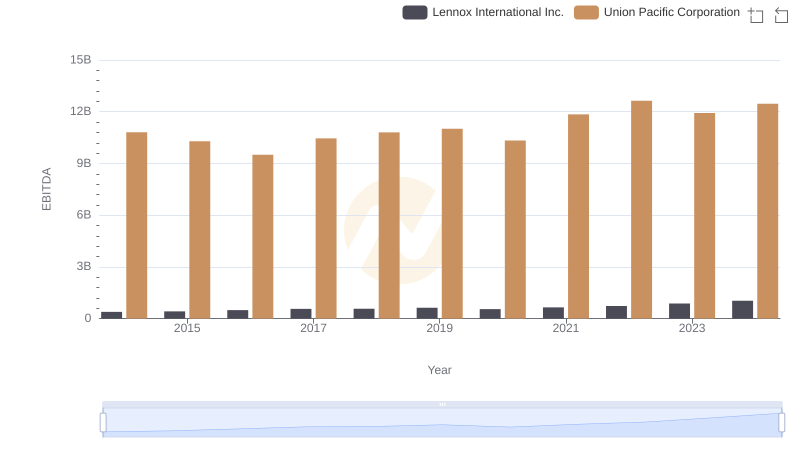
Union Pacific Corporation and Lennox International Inc.: A Detailed Examination of EBITDA Performance