| __timestamp | Lennox International Inc. | Union Pacific Corporation |
|---|---|---|
| Wednesday, January 1, 2014 | 387700000 | 10808000000 |
| Thursday, January 1, 2015 | 423600000 | 10290000000 |
| Friday, January 1, 2016 | 490800000 | 9502000000 |
| Sunday, January 1, 2017 | 562900000 | 10456000000 |
| Monday, January 1, 2018 | 575200000 | 10802000000 |
| Tuesday, January 1, 2019 | 633300000 | 11013000000 |
| Wednesday, January 1, 2020 | 553900000 | 10331000000 |
| Friday, January 1, 2021 | 652500000 | 11843000000 |
| Saturday, January 1, 2022 | 729000000 | 12636000000 |
| Sunday, January 1, 2023 | 879500000 | 11928000000 |
| Monday, January 1, 2024 | 1034800000 | 12461000000 |
In pursuit of knowledge
In the ever-evolving landscape of American industry, Union Pacific Corporation and Lennox International Inc. stand as titans in their respective fields. Over the past decade, from 2014 to 2024, these companies have demonstrated remarkable EBITDA growth, a key indicator of financial health and operational efficiency. Union Pacific, a leader in the transportation sector, has consistently outperformed with an average EBITDA of approximately $11 billion, peaking at $12.6 billion in 2022. This represents a robust 33% increase from its 2016 low. Meanwhile, Lennox International, a major player in the HVAC industry, has shown a commendable 167% growth in EBITDA, rising from $388 million in 2014 to over $1 billion in 2024. This growth trajectory highlights the resilience and strategic prowess of both companies, making them noteworthy case studies in financial performance and industry leadership.
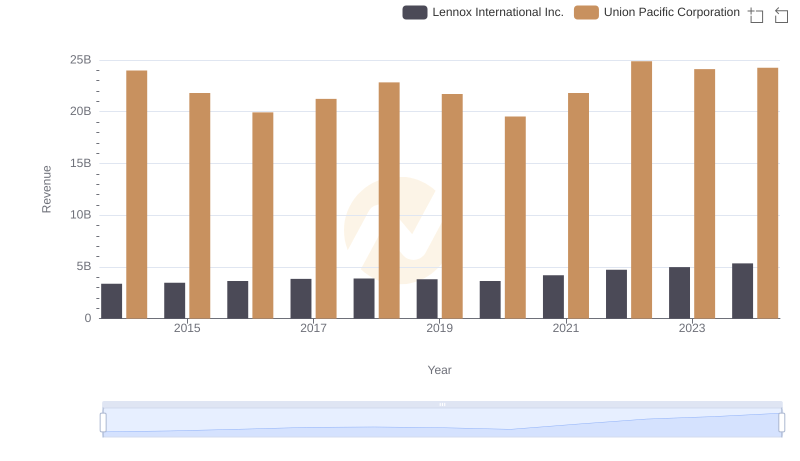
Breaking Down Revenue Trends: Union Pacific Corporation vs Lennox International Inc.
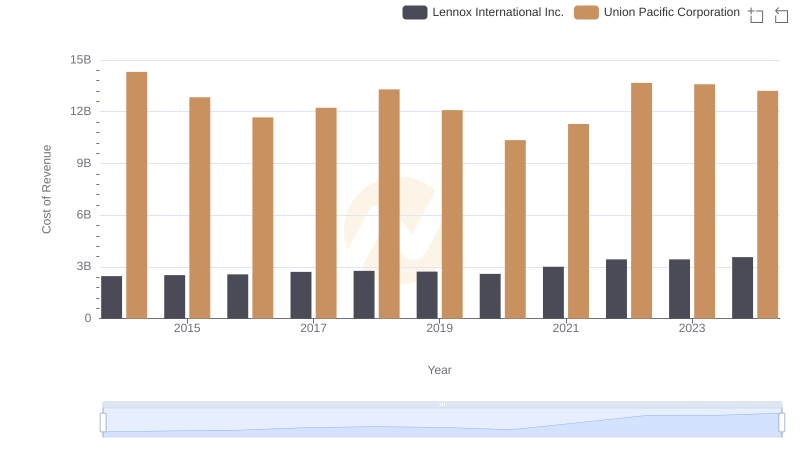
Union Pacific Corporation vs Lennox International Inc.: Efficiency in Cost of Revenue Explored
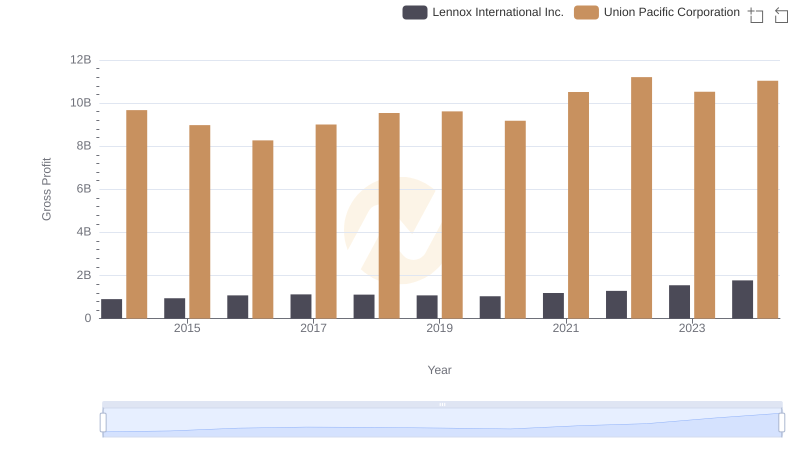
Who Generates Higher Gross Profit? Union Pacific Corporation or Lennox International Inc.
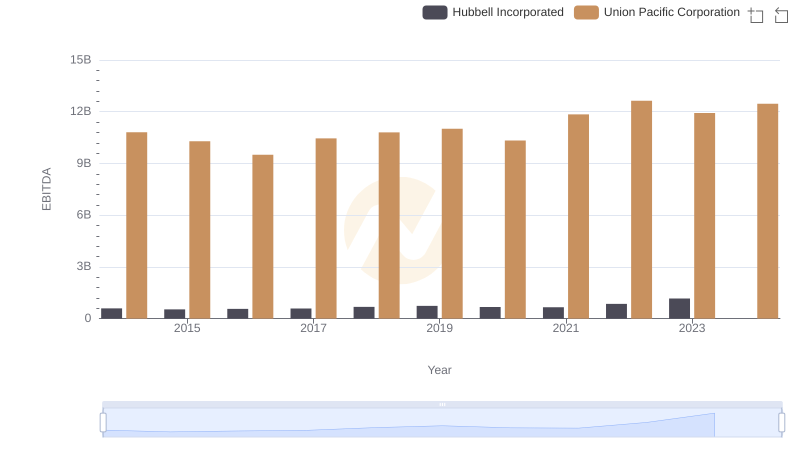
Union Pacific Corporation and Hubbell Incorporated: A Detailed Examination of EBITDA Performance
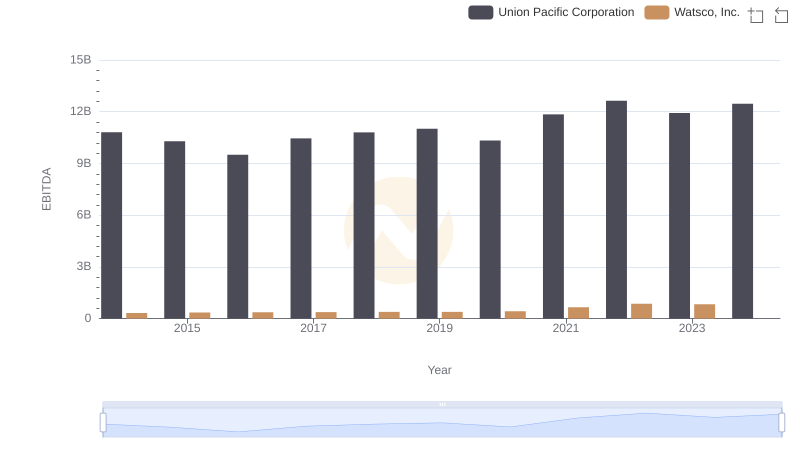
Comparative EBITDA Analysis: Union Pacific Corporation vs Watsco, Inc.
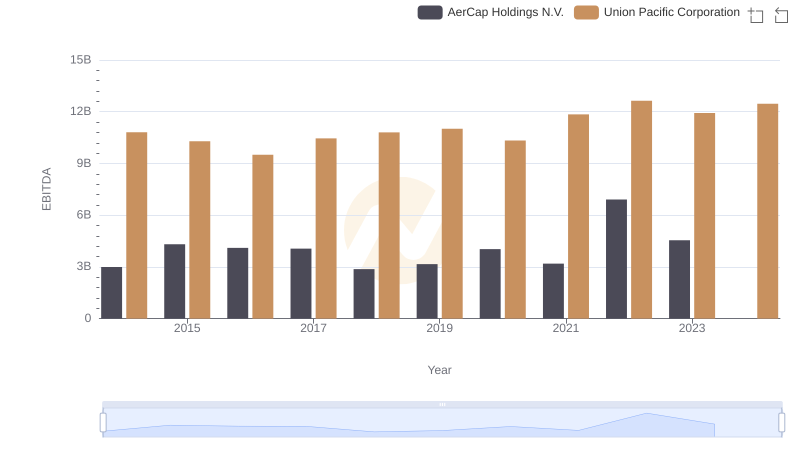
Comparative EBITDA Analysis: Union Pacific Corporation vs AerCap Holdings N.V.
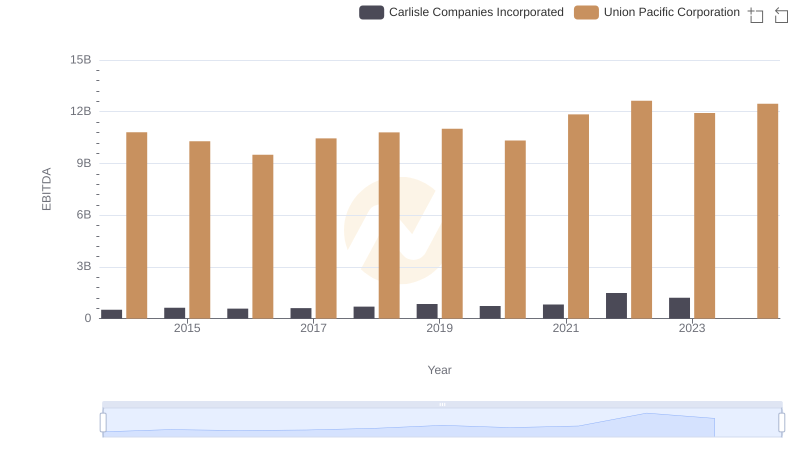
A Side-by-Side Analysis of EBITDA: Union Pacific Corporation and Carlisle Companies Incorporated