| __timestamp | Global Payments Inc. | Union Pacific Corporation |
|---|---|---|
| Wednesday, January 1, 2014 | 1751611000 | 9677000000 |
| Thursday, January 1, 2015 | 1750511000 | 8976000000 |
| Friday, January 1, 2016 | 1767444000 | 8269000000 |
| Sunday, January 1, 2017 | 2047126000 | 9009000000 |
| Monday, January 1, 2018 | 2271352000 | 9539000000 |
| Tuesday, January 1, 2019 | 2838089000 | 9614000000 |
| Wednesday, January 1, 2020 | 3772831000 | 9179000000 |
| Friday, January 1, 2021 | 4750037000 | 10514000000 |
| Saturday, January 1, 2022 | 5196898000 | 11205000000 |
| Sunday, January 1, 2023 | 5926898000 | 10529000000 |
| Monday, January 1, 2024 | 6345778000 | 11039000000 |
Unleashing insights
In the ever-evolving landscape of American business, Union Pacific Corporation and Global Payments Inc. stand as titans in their respective fields. Over the past decade, Union Pacific, a stalwart in the transportation sector, has consistently outperformed Global Payments, a leader in financial technology, in terms of gross profit. From 2014 to 2023, Union Pacific's gross profit surged by approximately 16%, peaking in 2022. Meanwhile, Global Payments experienced a remarkable growth of over 238% during the same period, reflecting the rapid expansion and adoption of digital payment solutions.
Despite Union Pacific's larger profit margins, Global Payments' growth trajectory highlights the shifting dynamics in the global economy. As we look to the future, the missing data for 2024 leaves us anticipating how these industry giants will adapt to new challenges and opportunities.
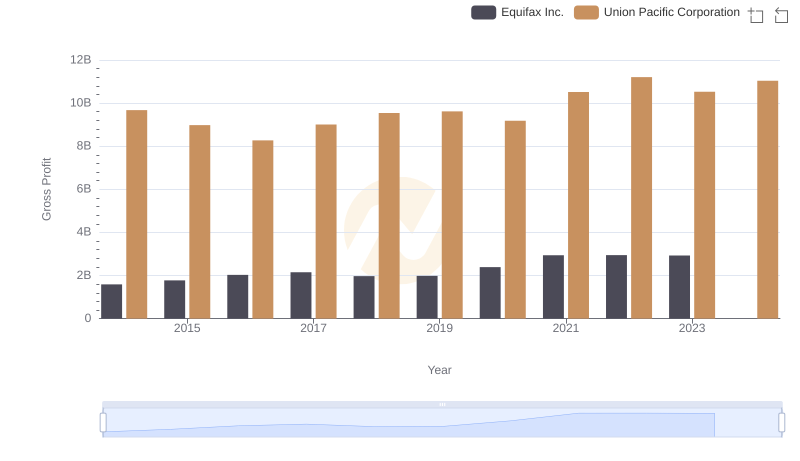
Union Pacific Corporation and Equifax Inc.: A Detailed Gross Profit Analysis
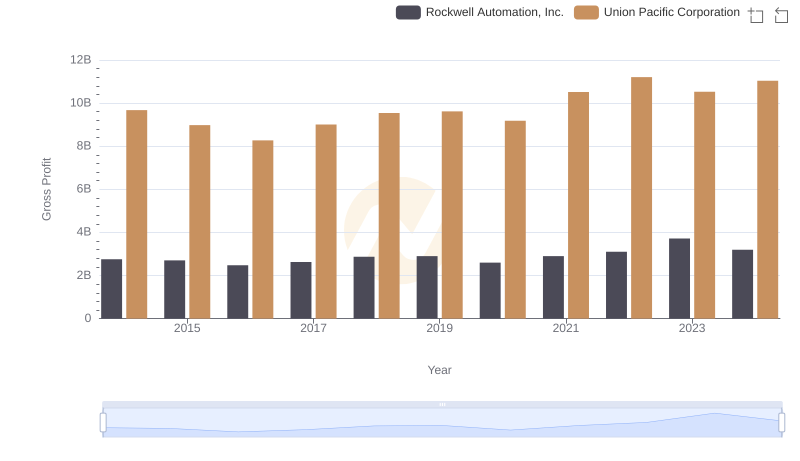
Gross Profit Analysis: Comparing Union Pacific Corporation and Rockwell Automation, Inc.
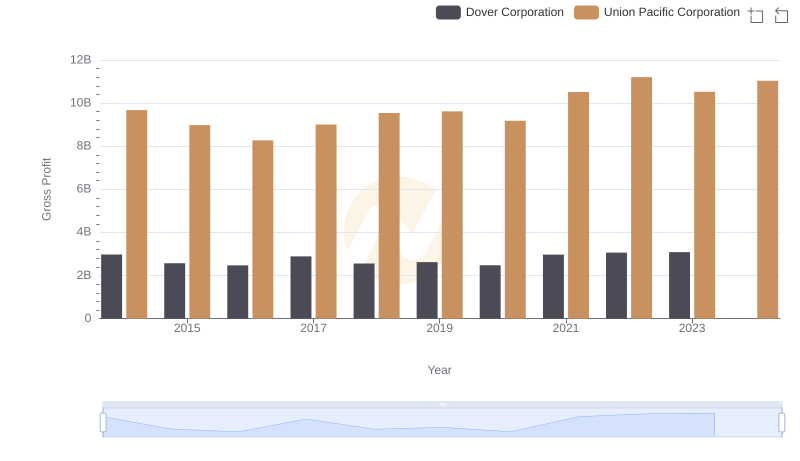
Gross Profit Trends Compared: Union Pacific Corporation vs Dover Corporation
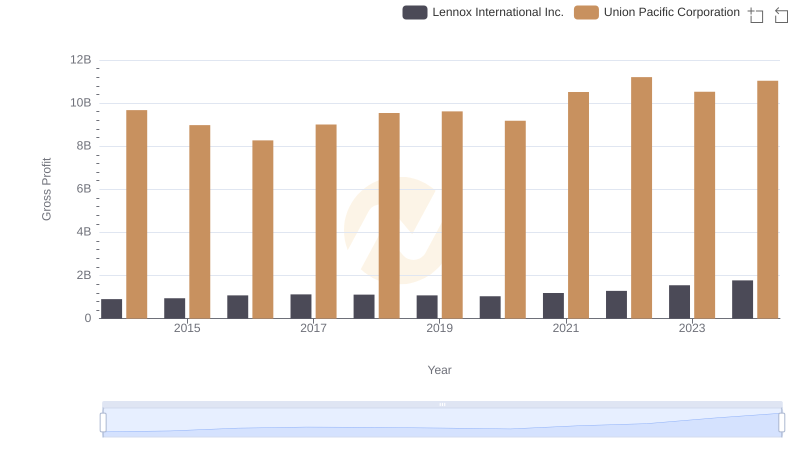
Who Generates Higher Gross Profit? Union Pacific Corporation or Lennox International Inc.