| __timestamp | Lennox International Inc. | Union Pacific Corporation |
|---|---|---|
| Wednesday, January 1, 2014 | 3367400000 | 23988000000 |
| Thursday, January 1, 2015 | 3467400000 | 21813000000 |
| Friday, January 1, 2016 | 3641600000 | 19941000000 |
| Sunday, January 1, 2017 | 3839600000 | 21240000000 |
| Monday, January 1, 2018 | 3883900000 | 22832000000 |
| Tuesday, January 1, 2019 | 3807200000 | 21708000000 |
| Wednesday, January 1, 2020 | 3634100000 | 19533000000 |
| Friday, January 1, 2021 | 4194100000 | 21804000000 |
| Saturday, January 1, 2022 | 4718400000 | 24875000000 |
| Sunday, January 1, 2023 | 4981900000 | 24119000000 |
| Monday, January 1, 2024 | 5341300000 | 24250000000 |
Unleashing insights
In the ever-evolving landscape of American industry, Union Pacific Corporation and Lennox International Inc. stand as titans in their respective fields. Over the past decade, from 2014 to 2024, these companies have showcased distinct revenue trajectories. Union Pacific, a leader in the transportation sector, has consistently generated revenues around 22 billion USD annually, peaking at 24.9 billion USD in 2022. Meanwhile, Lennox International, a key player in climate control solutions, has seen a steady rise, with revenues growing by approximately 59% from 2014 to 2024, reaching 5.3 billion USD. This growth reflects Lennox's strategic market expansions and innovations. The data highlights the resilience and adaptability of these corporations, offering insights into their financial health and market strategies. As we delve deeper into these trends, it becomes evident that both companies are navigating their paths with precision and foresight.
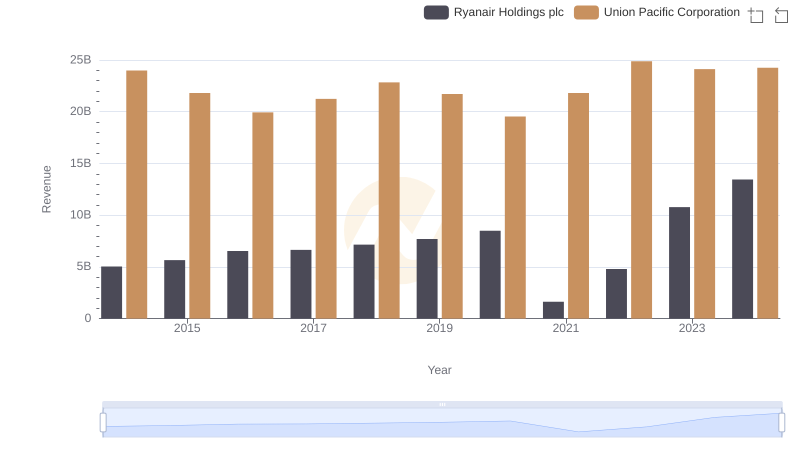
Union Pacific Corporation vs Ryanair Holdings plc: Annual Revenue Growth Compared

Union Pacific Corporation vs Watsco, Inc.: Examining Key Revenue Metrics
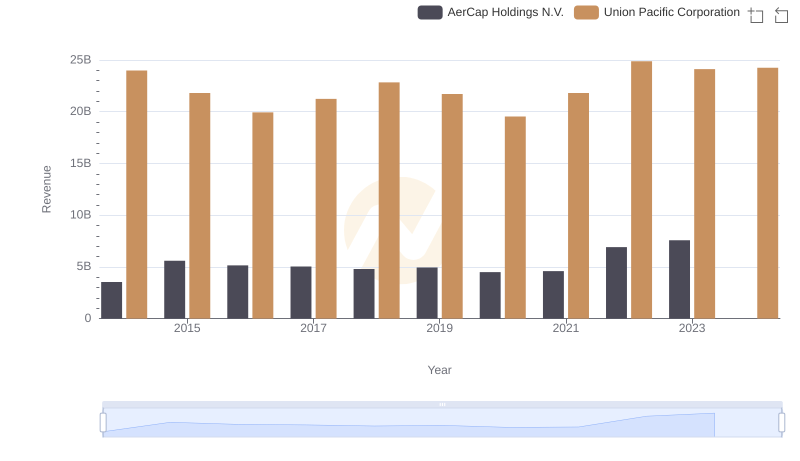
Union Pacific Corporation or AerCap Holdings N.V.: Who Leads in Yearly Revenue?
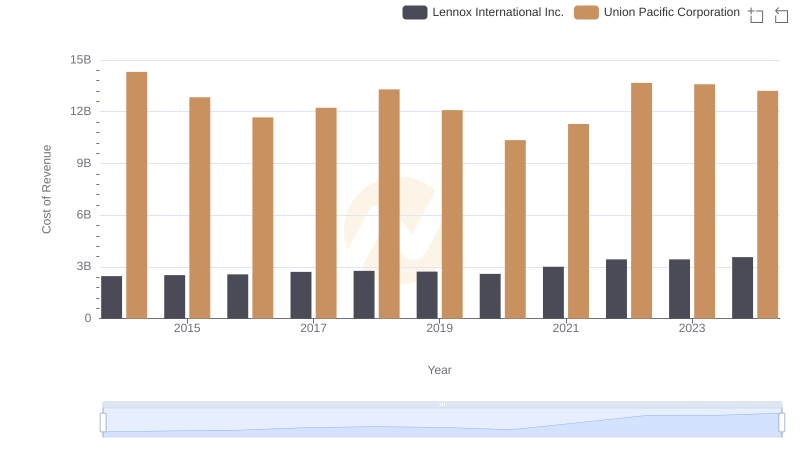
Union Pacific Corporation vs Lennox International Inc.: Efficiency in Cost of Revenue Explored
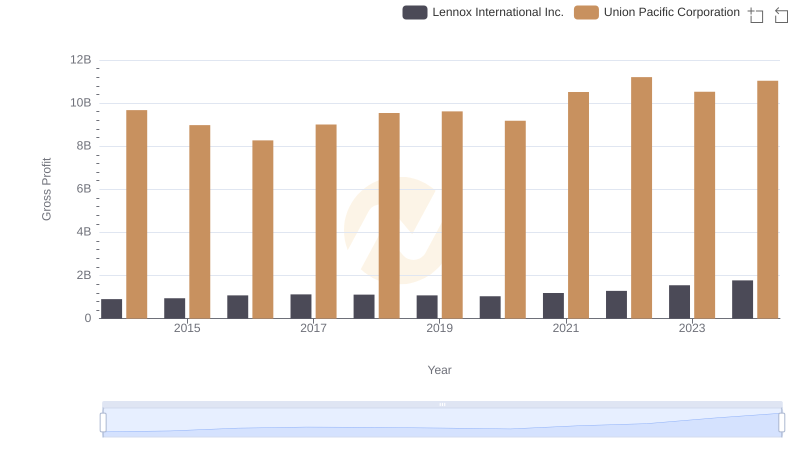
Who Generates Higher Gross Profit? Union Pacific Corporation or Lennox International Inc.
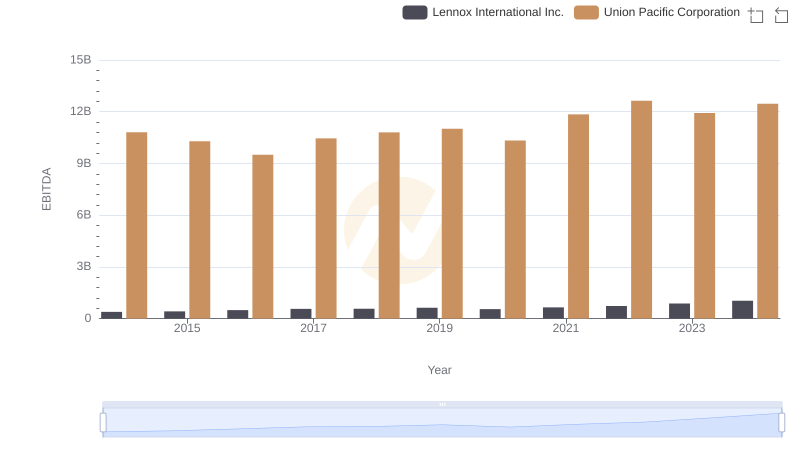
Union Pacific Corporation and Lennox International Inc.: A Detailed Examination of EBITDA Performance