| __timestamp | Dover Corporation | Union Pacific Corporation |
|---|---|---|
| Wednesday, January 1, 2014 | 2974249000 | 9677000000 |
| Thursday, January 1, 2015 | 2568144000 | 8976000000 |
| Friday, January 1, 2016 | 2471969000 | 8269000000 |
| Sunday, January 1, 2017 | 2890377000 | 9009000000 |
| Monday, January 1, 2018 | 2559556000 | 9539000000 |
| Tuesday, January 1, 2019 | 2620938000 | 9614000000 |
| Wednesday, January 1, 2020 | 2474019000 | 9179000000 |
| Friday, January 1, 2021 | 2969786000 | 10514000000 |
| Saturday, January 1, 2022 | 3063556000 | 11205000000 |
| Sunday, January 1, 2023 | 3084633000 | 10529000000 |
| Monday, January 1, 2024 | 2958621000 | 11039000000 |
Igniting the spark of knowledge
In the ever-evolving landscape of American industry, Union Pacific Corporation and Dover Corporation stand as titans in their respective fields. Over the past decade, from 2014 to 2023, Union Pacific has consistently outperformed Dover in terms of gross profit, showcasing a robust growth trajectory. Union Pacific's gross profit surged by approximately 16% from 2014 to 2023, peaking at over $11 billion in 2022. In contrast, Dover Corporation experienced a more modest growth of around 4% during the same period, with its gross profit reaching just over $3 billion in 2023.
The data reveals a compelling narrative of resilience and strategic prowess, particularly for Union Pacific, which maintained a steady upward trend despite economic fluctuations. However, the absence of data for Dover in 2024 suggests potential challenges or reporting delays. As these corporations navigate the future, their financial strategies will be pivotal in shaping their competitive edge.
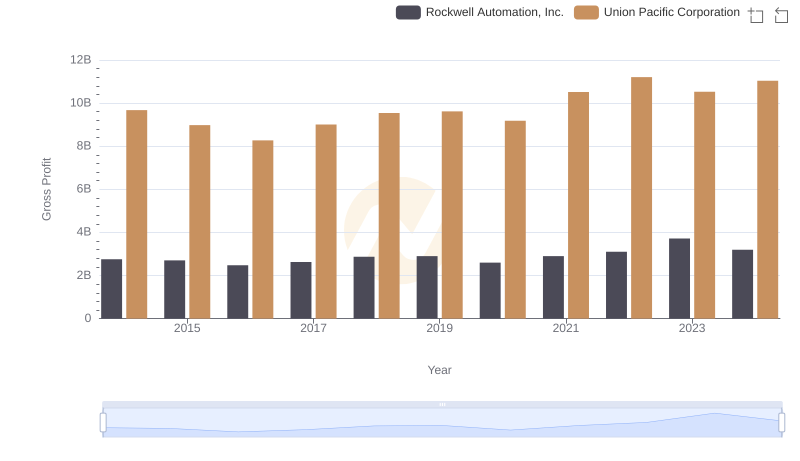
Gross Profit Analysis: Comparing Union Pacific Corporation and Rockwell Automation, Inc.
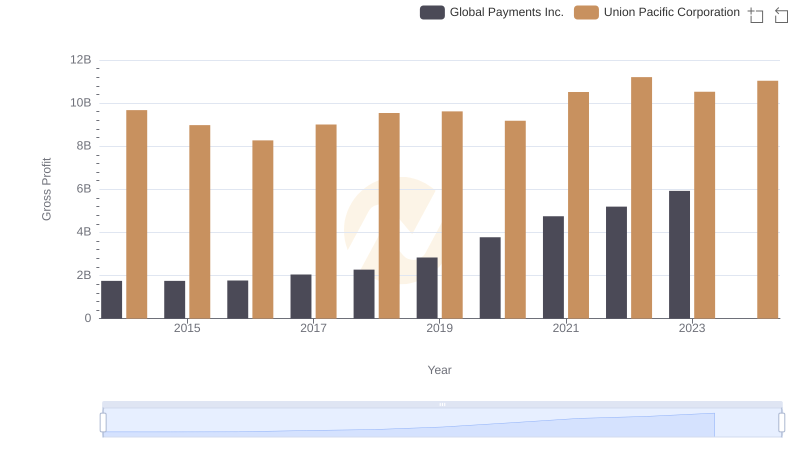
Gross Profit Comparison: Union Pacific Corporation and Global Payments Inc. Trends
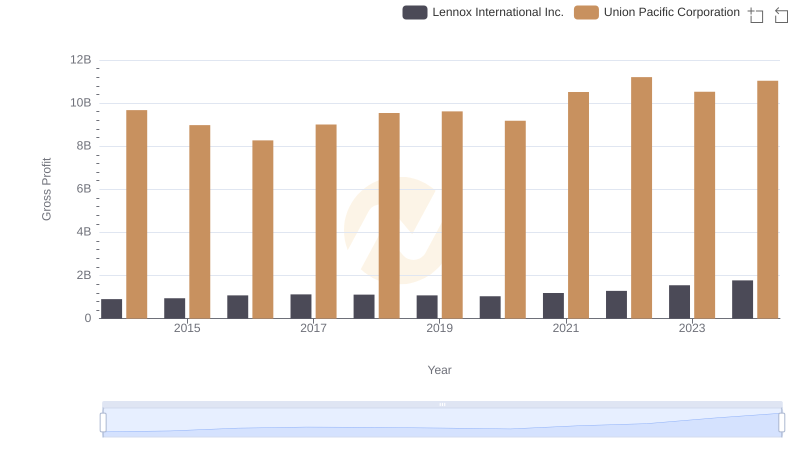
Who Generates Higher Gross Profit? Union Pacific Corporation or Lennox International Inc.
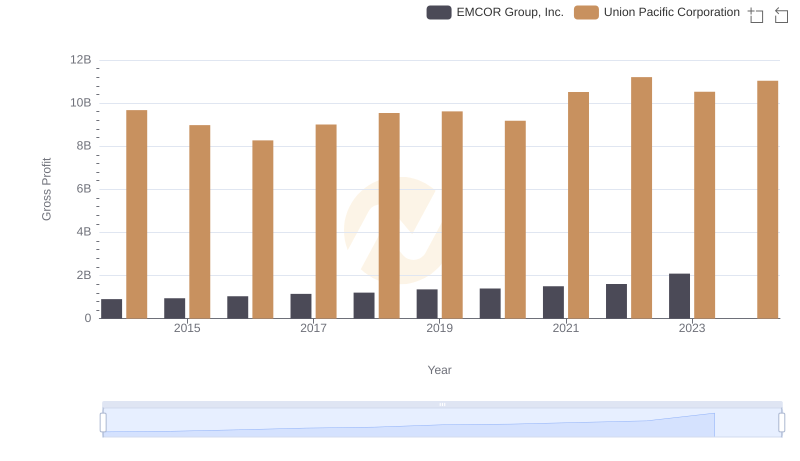
Union Pacific Corporation vs EMCOR Group, Inc.: A Gross Profit Performance Breakdown