| __timestamp | RB Global, Inc. | Watsco, Inc. |
|---|---|---|
| Wednesday, January 1, 2014 | 481097000 | 3944540000 |
| Thursday, January 1, 2015 | 515875000 | 4113239000 |
| Friday, January 1, 2016 | 566395000 | 4220702000 |
| Sunday, January 1, 2017 | 610517000 | 4341955000 |
| Monday, January 1, 2018 | 1170026000 | 4546653000 |
| Tuesday, January 1, 2019 | 1318641000 | 4770362000 |
| Wednesday, January 1, 2020 | 1377260000 | 5054928000 |
| Friday, January 1, 2021 | 1416971000 | 6280192000 |
| Saturday, January 1, 2022 | 1733808000 | 7274344000 |
| Sunday, January 1, 2023 | 3679600000 | 7283767000 |
| Monday, January 1, 2024 | 4284200000 | 7618317000 |
Infusing magic into the data realm
In the ever-evolving landscape of industrial giants, Watsco, Inc. and RB Global, Inc. have carved distinct paths over the past decade. From 2014 to 2023, Watsco, Inc. has consistently outperformed RB Global, Inc. in revenue generation, showcasing a robust growth trajectory. Starting at approximately $3.9 billion in 2014, Watsco's revenue surged by nearly 85% to reach over $7.2 billion by 2023. This growth reflects Watsco's strategic market positioning and operational efficiency.
Conversely, RB Global, Inc. experienced a more modest growth, with revenue increasing from around $481 million in 2014 to approximately $3.7 billion in 2023. This represents a significant growth rate, yet it pales in comparison to Watsco's financial ascent. The data highlights the dynamic nature of the industrial sector and underscores the importance of strategic foresight in achieving sustained growth.
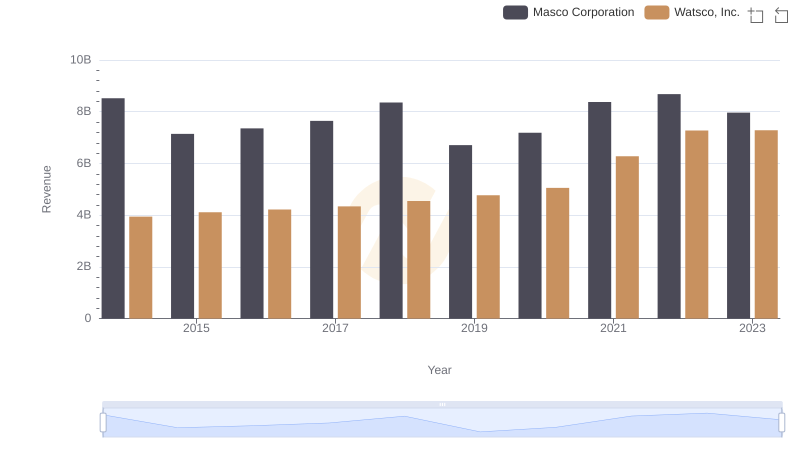
Revenue Insights: Watsco, Inc. and Masco Corporation Performance Compared
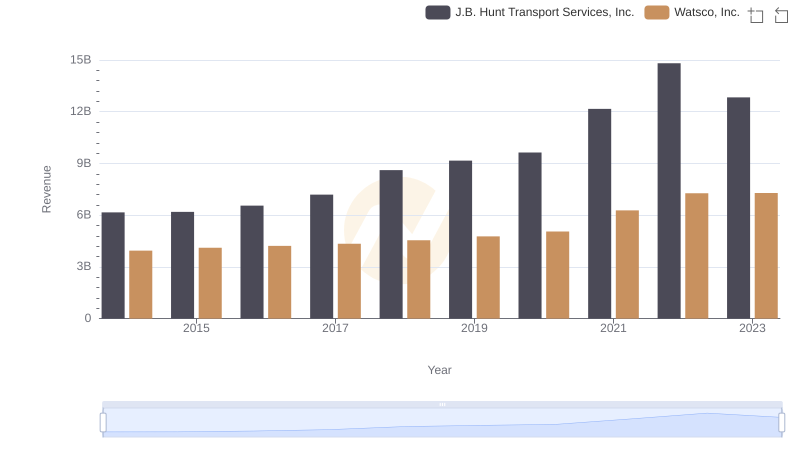
Watsco, Inc. vs J.B. Hunt Transport Services, Inc.: Annual Revenue Growth Compared
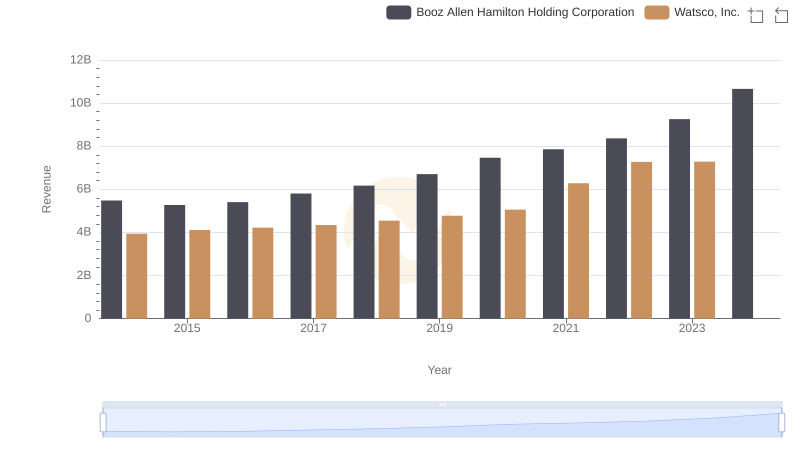
Watsco, Inc. vs Booz Allen Hamilton Holding Corporation: Annual Revenue Growth Compared
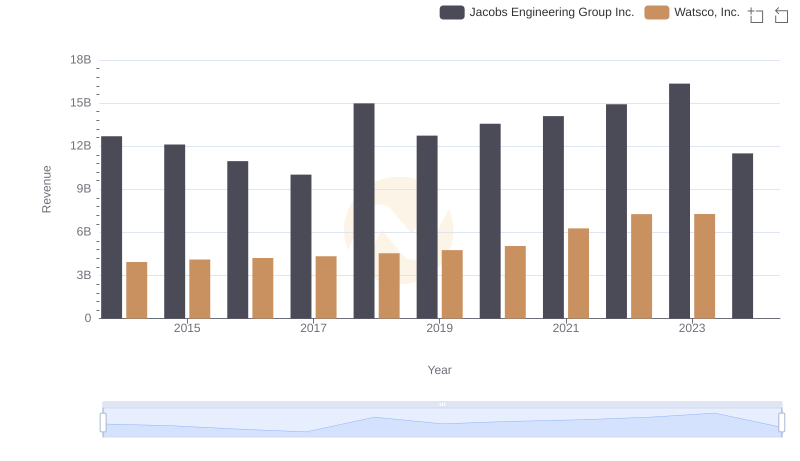
Breaking Down Revenue Trends: Watsco, Inc. vs Jacobs Engineering Group Inc.
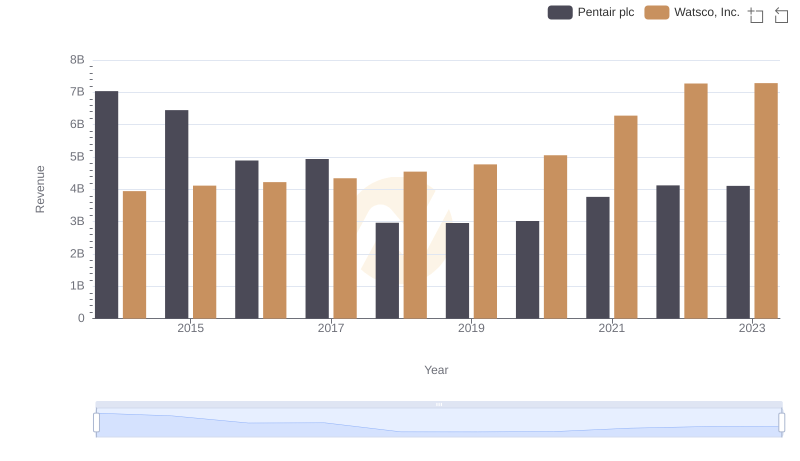
Revenue Insights: Watsco, Inc. and Pentair plc Performance Compared
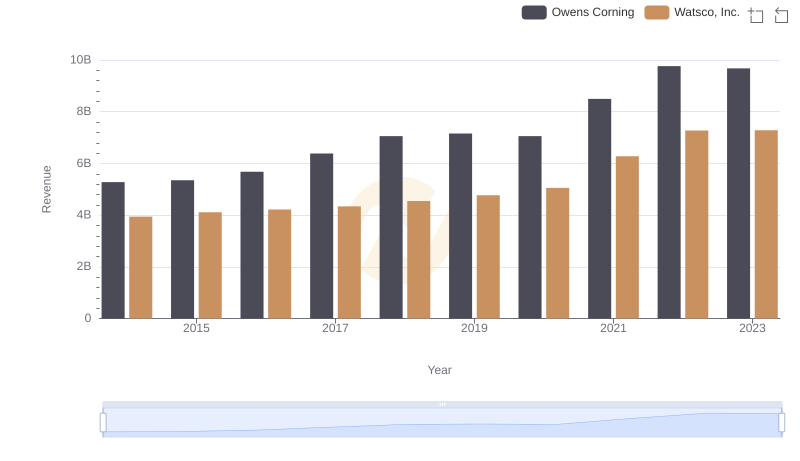
Watsco, Inc. vs Owens Corning: Annual Revenue Growth Compared
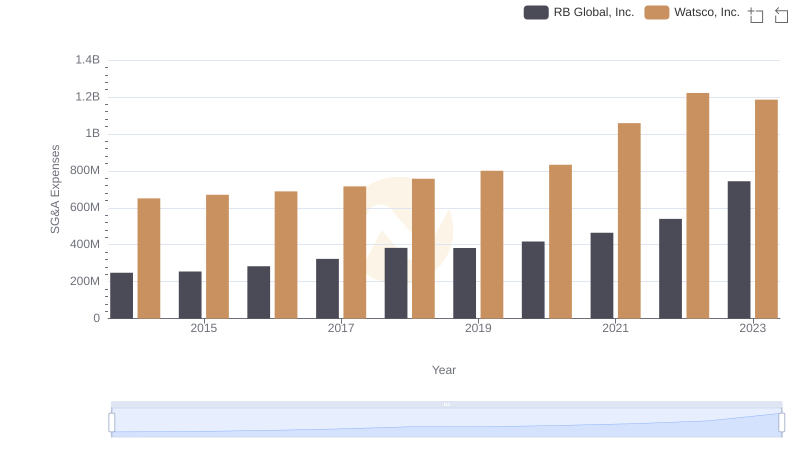
Selling, General, and Administrative Costs: Watsco, Inc. vs RB Global, Inc.
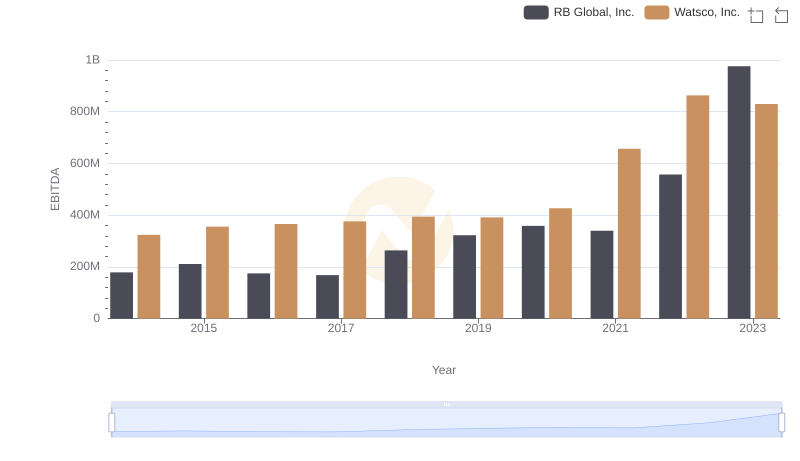
Comprehensive EBITDA Comparison: Watsco, Inc. vs RB Global, Inc.