| __timestamp | CNH Industrial N.V. | Watsco, Inc. |
|---|---|---|
| Wednesday, January 1, 2014 | 32555000000 | 3944540000 |
| Thursday, January 1, 2015 | 25912000000 | 4113239000 |
| Friday, January 1, 2016 | 24872000000 | 4220702000 |
| Sunday, January 1, 2017 | 27361000000 | 4341955000 |
| Monday, January 1, 2018 | 29706000000 | 4546653000 |
| Tuesday, January 1, 2019 | 28079000000 | 4770362000 |
| Wednesday, January 1, 2020 | 26032000000 | 5054928000 |
| Friday, January 1, 2021 | 33428000000 | 6280192000 |
| Saturday, January 1, 2022 | 23551000000 | 7274344000 |
| Sunday, January 1, 2023 | 24694000000 | 7283767000 |
| Monday, January 1, 2024 | 7618317000 |
Data in motion
In the ever-evolving landscape of industrial and commercial sectors, revenue performance is a key indicator of success. Over the past decade, Watsco, Inc. and CNH Industrial N.V. have showcased contrasting trajectories. From 2014 to 2023, CNH Industrial N.V. experienced a revenue decline of approximately 24%, starting at 100% in 2014 and dropping to 76% by 2023. In contrast, Watsco, Inc. demonstrated a robust growth of around 85%, with revenues climbing from 100% in 2014 to 185% in 2023.
This divergence highlights the resilience and strategic prowess of Watsco, Inc. in navigating market challenges, while CNH Industrial N.V. faced hurdles that impacted its revenue stream. As we delve into these figures, it becomes evident that adaptability and innovation are crucial for sustained growth in today's competitive environment.
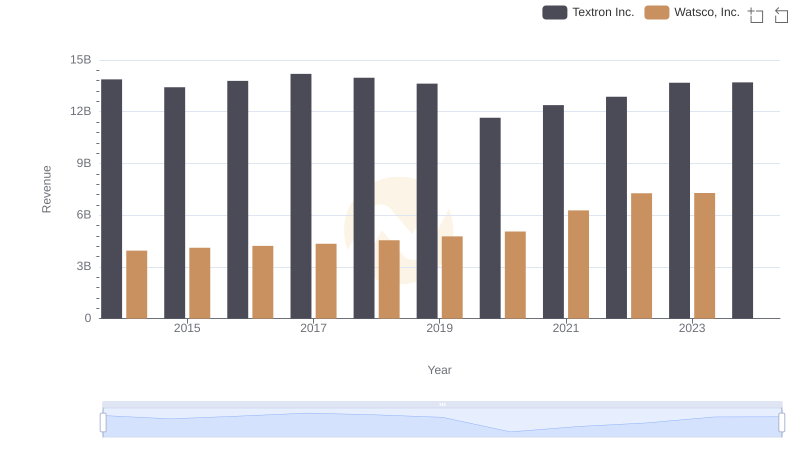
Breaking Down Revenue Trends: Watsco, Inc. vs Textron Inc.
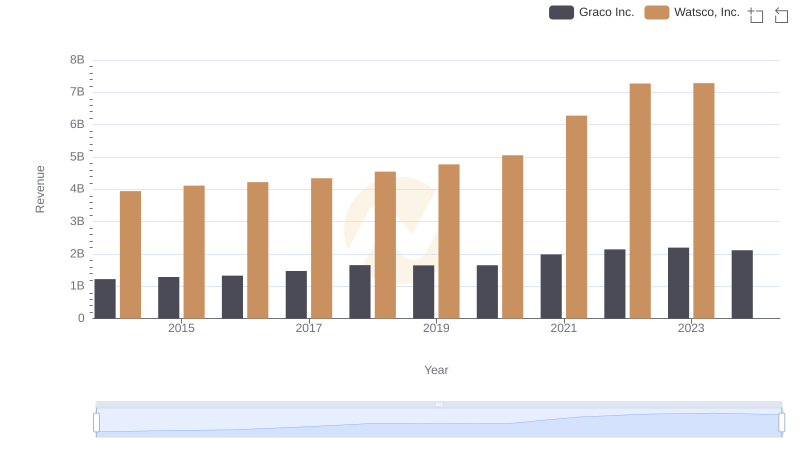
Watsco, Inc. or Graco Inc.: Who Leads in Yearly Revenue?
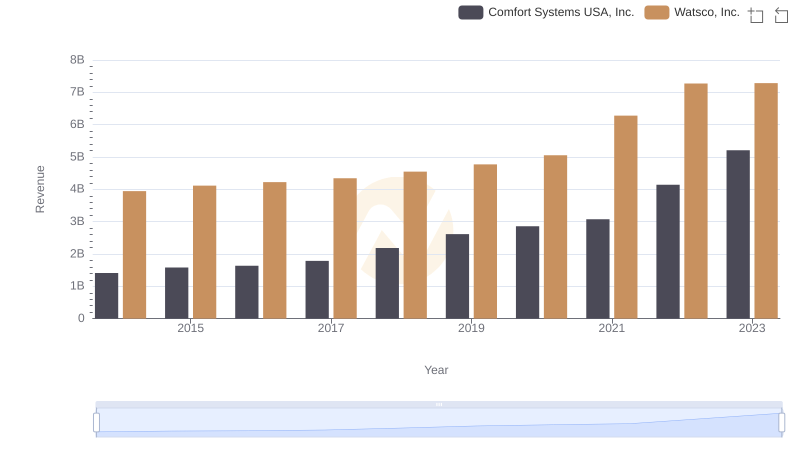
Watsco, Inc. or Comfort Systems USA, Inc.: Who Leads in Yearly Revenue?
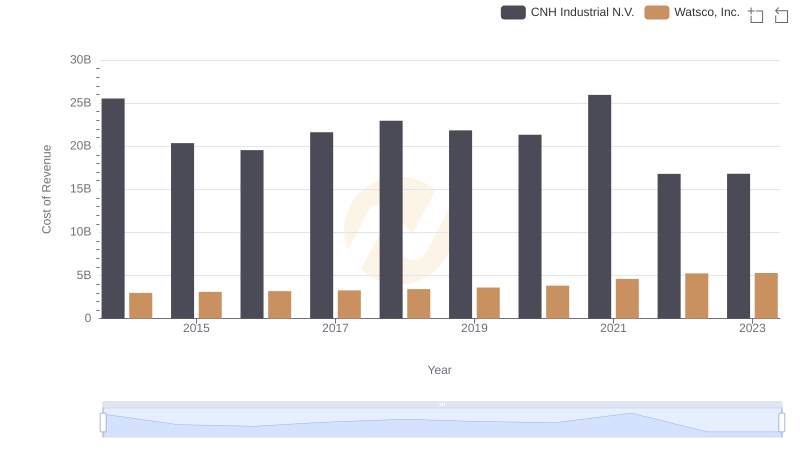
Watsco, Inc. vs CNH Industrial N.V.: Efficiency in Cost of Revenue Explored
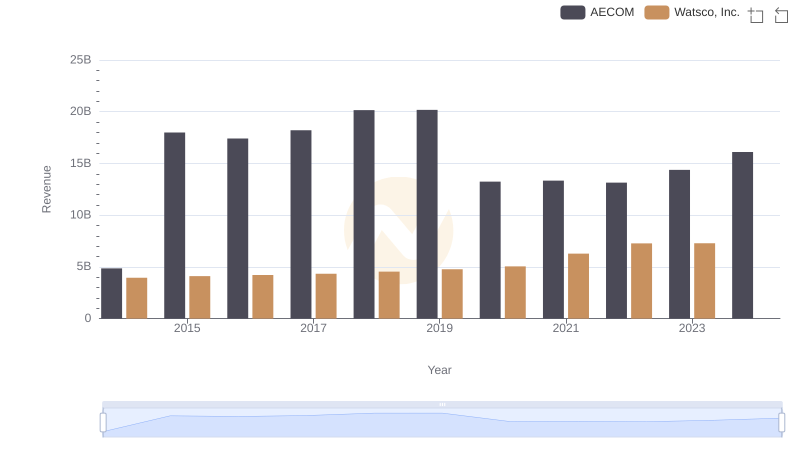
Watsco, Inc. vs AECOM: Annual Revenue Growth Compared
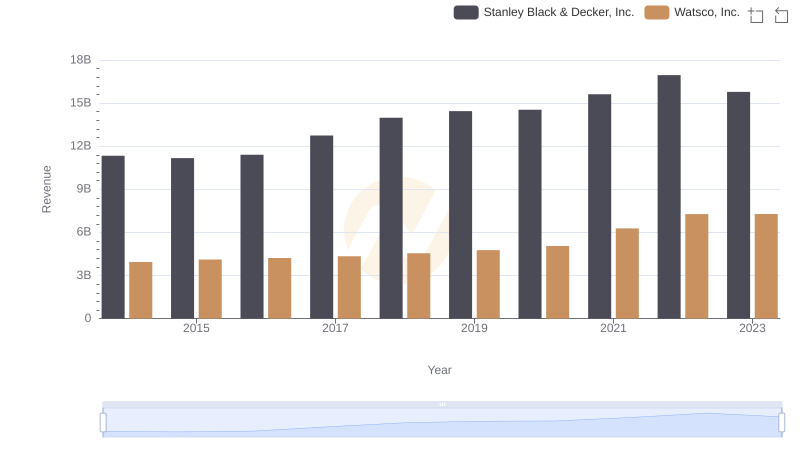
Who Generates More Revenue? Watsco, Inc. or Stanley Black & Decker, Inc.
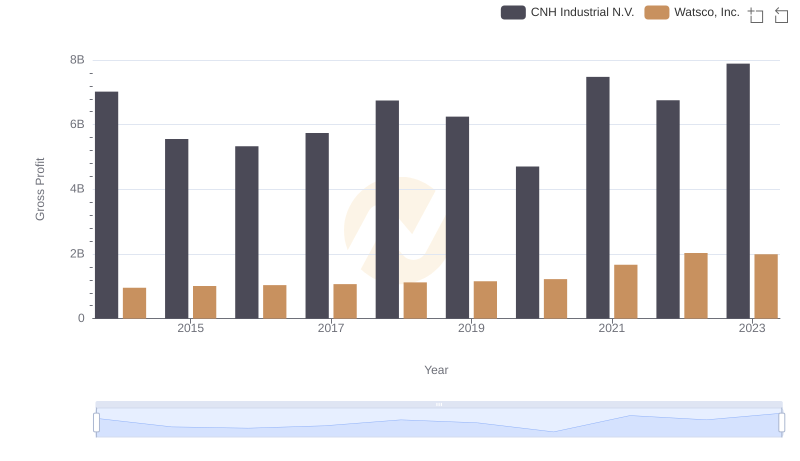
Watsco, Inc. vs CNH Industrial N.V.: A Gross Profit Performance Breakdown
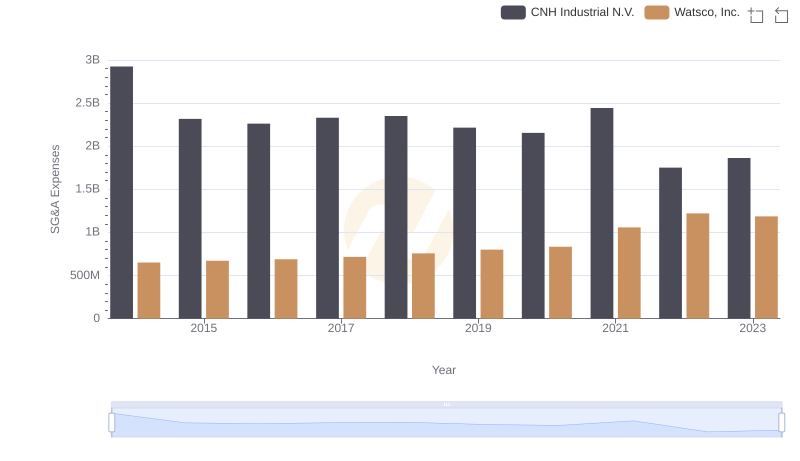
Selling, General, and Administrative Costs: Watsco, Inc. vs CNH Industrial N.V.
Professional EBITDA Benchmarking: Watsco, Inc. vs CNH Industrial N.V.