| __timestamp | Pool Corporation | Watsco, Inc. |
|---|---|---|
| Wednesday, January 1, 2014 | 643340000 | 956402000 |
| Thursday, January 1, 2015 | 675644000 | 1007357000 |
| Friday, January 1, 2016 | 741087000 | 1034584000 |
| Sunday, January 1, 2017 | 805289000 | 1065659000 |
| Monday, January 1, 2018 | 870173000 | 1120252000 |
| Tuesday, January 1, 2019 | 924925000 | 1156956000 |
| Wednesday, January 1, 2020 | 1130902000 | 1222821000 |
| Friday, January 1, 2021 | 1617092000 | 1667545000 |
| Saturday, January 1, 2022 | 1933412000 | 2030289000 |
| Sunday, January 1, 2023 | 1660044000 | 1992140000 |
| Monday, January 1, 2024 | 2044713000 |
Unleashing insights
In the ever-evolving landscape of the HVAC and pool supply industries, Watsco, Inc. and Pool Corporation have emerged as formidable players. Over the past decade, these companies have demonstrated remarkable growth in their gross profits, reflecting their strategic prowess and market adaptability. From 2014 to 2023, Watsco, Inc. saw its gross profit soar by approximately 108%, while Pool Corporation experienced an impressive 158% increase. This growth trajectory highlights the resilience and innovation of these companies in navigating market challenges.
These insights underscore the dynamic nature of the industry and the strategic maneuvers of these leading corporations.
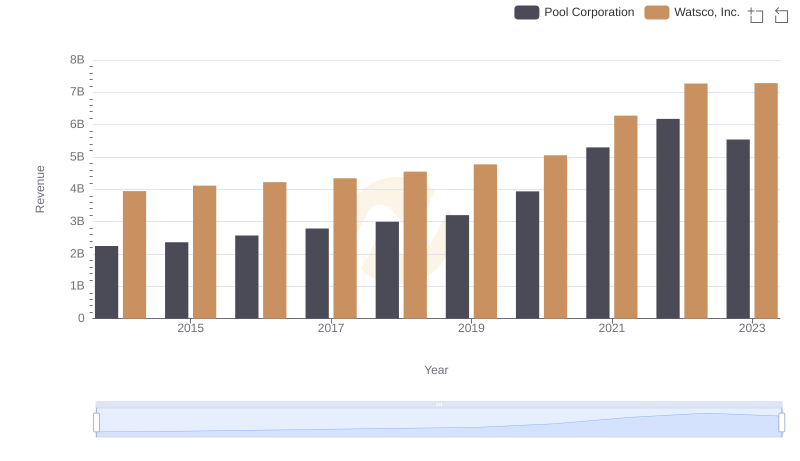
Watsco, Inc. vs Pool Corporation: Annual Revenue Growth Compared
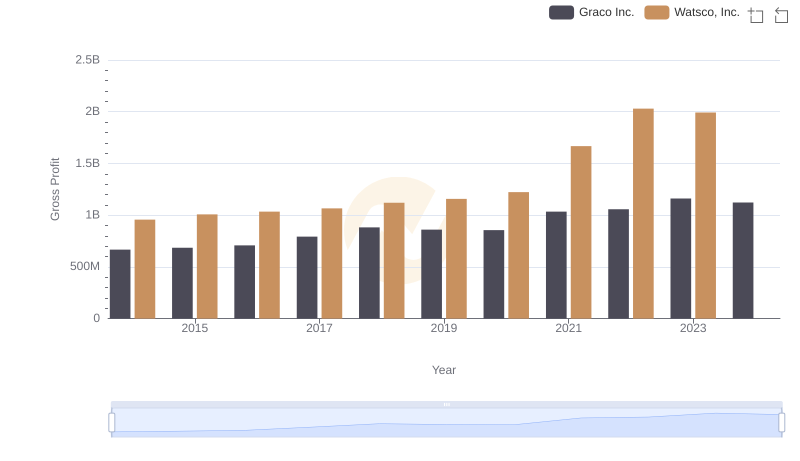
Who Generates Higher Gross Profit? Watsco, Inc. or Graco Inc.
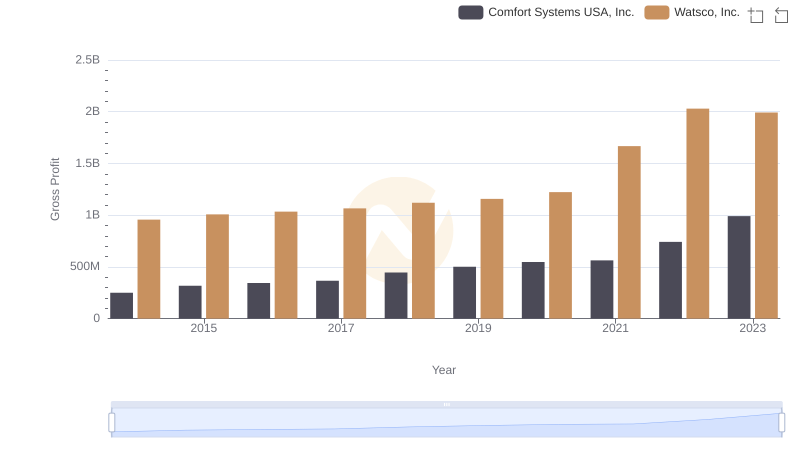
Gross Profit Comparison: Watsco, Inc. and Comfort Systems USA, Inc. Trends
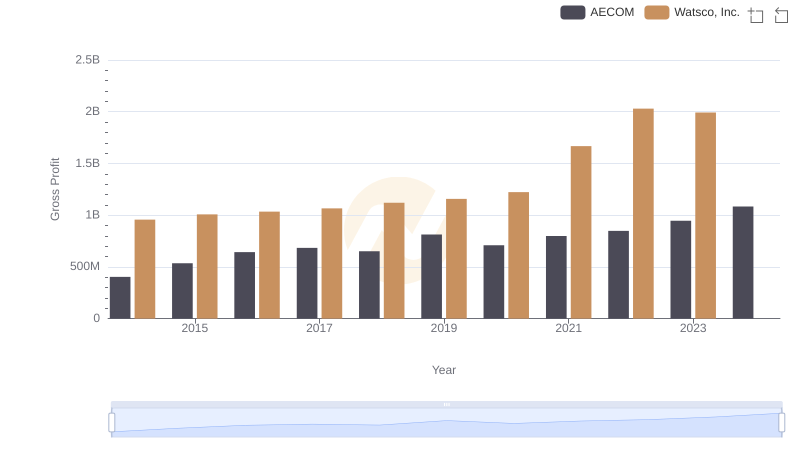
Who Generates Higher Gross Profit? Watsco, Inc. or AECOM
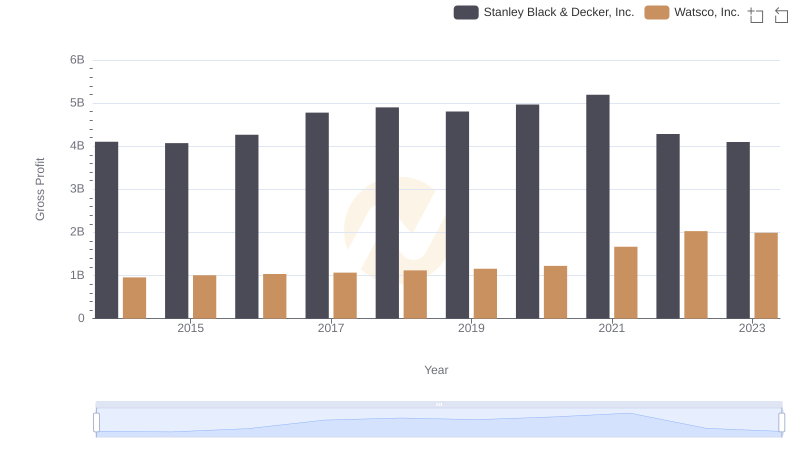
Gross Profit Trends Compared: Watsco, Inc. vs Stanley Black & Decker, Inc.
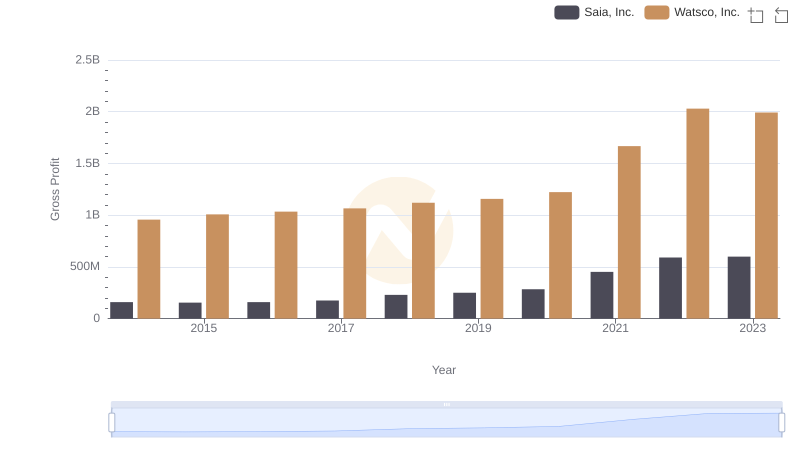
Gross Profit Analysis: Comparing Watsco, Inc. and Saia, Inc.
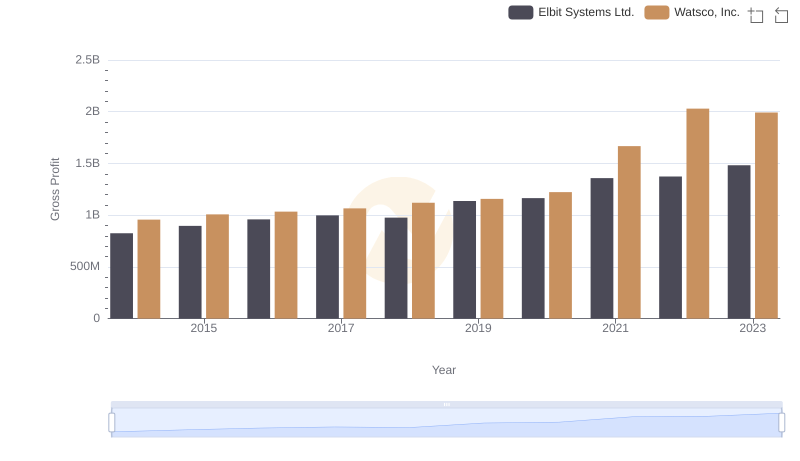
Gross Profit Analysis: Comparing Watsco, Inc. and Elbit Systems Ltd.

Gross Profit Comparison: Watsco, Inc. and Curtiss-Wright Corporation Trends
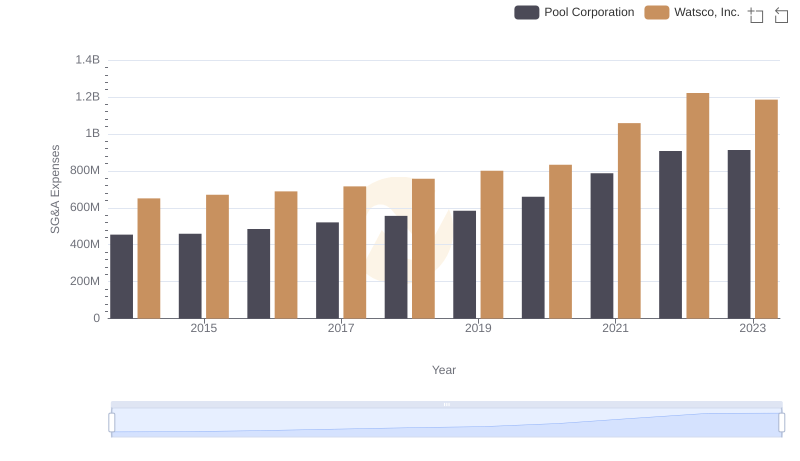
Breaking Down SG&A Expenses: Watsco, Inc. vs Pool Corporation