| __timestamp | Avery Dennison Corporation | Watsco, Inc. |
|---|---|---|
| Wednesday, January 1, 2014 | 1155300000 | 650655000 |
| Thursday, January 1, 2015 | 1108100000 | 670609000 |
| Friday, January 1, 2016 | 1097500000 | 688952000 |
| Sunday, January 1, 2017 | 1123200000 | 715671000 |
| Monday, January 1, 2018 | 1127500000 | 757452000 |
| Tuesday, January 1, 2019 | 1080400000 | 800328000 |
| Wednesday, January 1, 2020 | 1060500000 | 833051000 |
| Friday, January 1, 2021 | 1248500000 | 1058316000 |
| Saturday, January 1, 2022 | 1330800000 | 1221382000 |
| Sunday, January 1, 2023 | 1177900000 | 1185626000 |
| Monday, January 1, 2024 | 1415300000 | 1262938000 |
Unleashing the power of data
In the world of corporate finance, understanding a company's spending patterns can reveal much about its strategic priorities. Over the past decade, Watsco, Inc. and Avery Dennison Corporation have shown distinct trends in their Selling, General, and Administrative (SG&A) expenses. From 2014 to 2023, Avery Dennison's SG&A expenses have seen a modest increase of approximately 2% annually, peaking in 2022. In contrast, Watsco's expenses have grown more significantly, with a notable 82% increase from 2014 to 2023. This divergence highlights differing operational strategies, with Watsco potentially investing more aggressively in growth and expansion. As of 2023, both companies have converged, spending nearly equal amounts on SG&A, reflecting a dynamic shift in their financial strategies. These insights provide a window into how these industry leaders are navigating the ever-evolving business landscape.
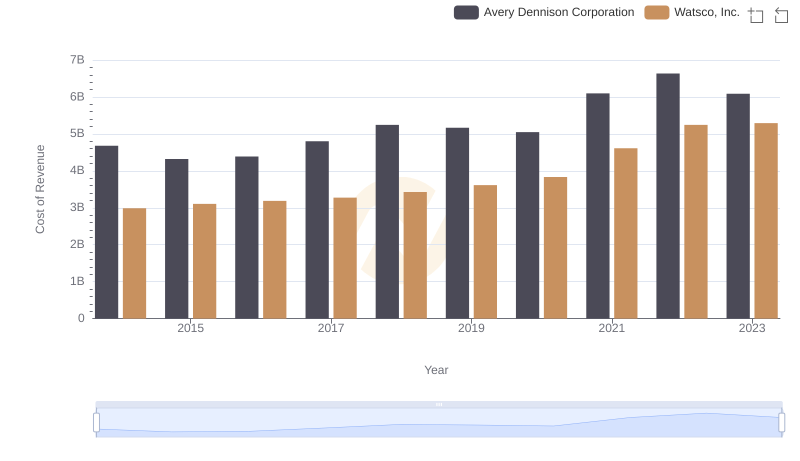
Cost of Revenue Comparison: Watsco, Inc. vs Avery Dennison Corporation
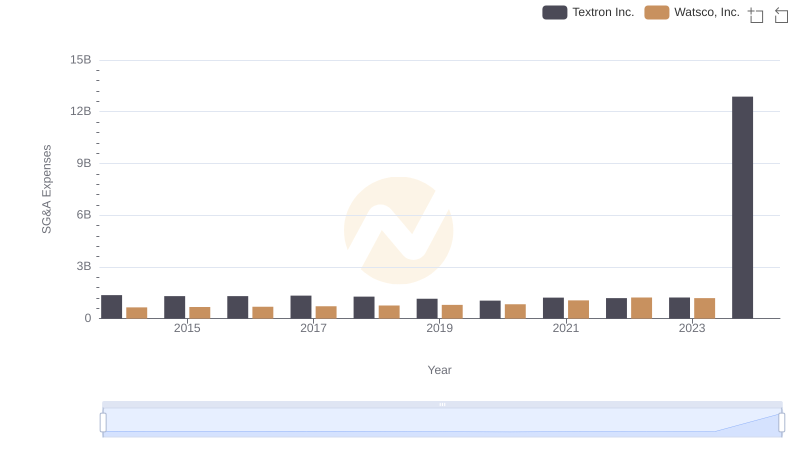
Operational Costs Compared: SG&A Analysis of Watsco, Inc. and Textron Inc.
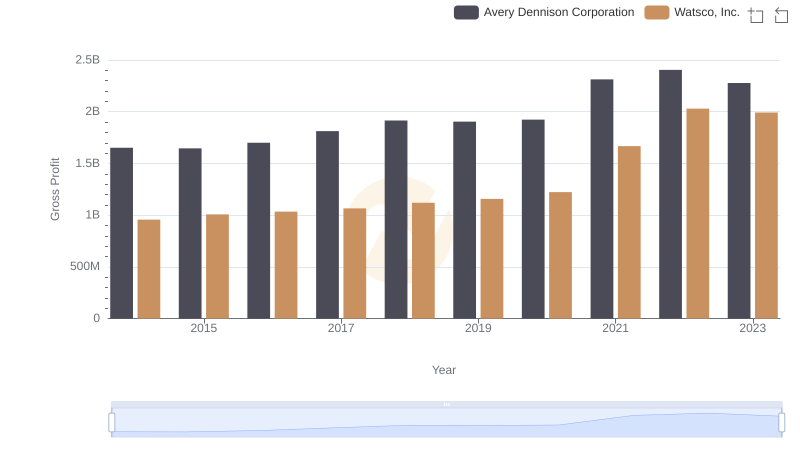
Gross Profit Comparison: Watsco, Inc. and Avery Dennison Corporation Trends
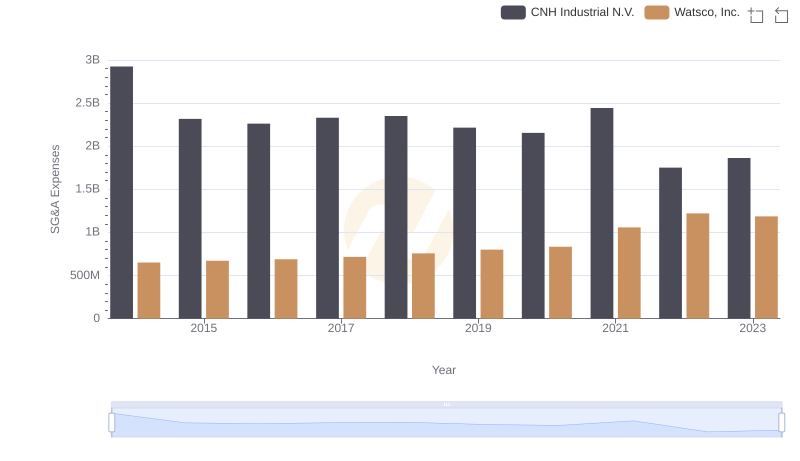
Selling, General, and Administrative Costs: Watsco, Inc. vs CNH Industrial N.V.
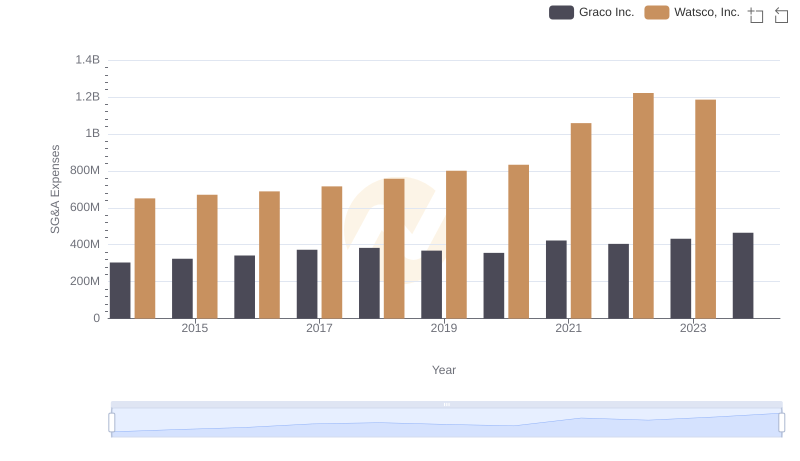
Watsco, Inc. or Graco Inc.: Who Manages SG&A Costs Better?
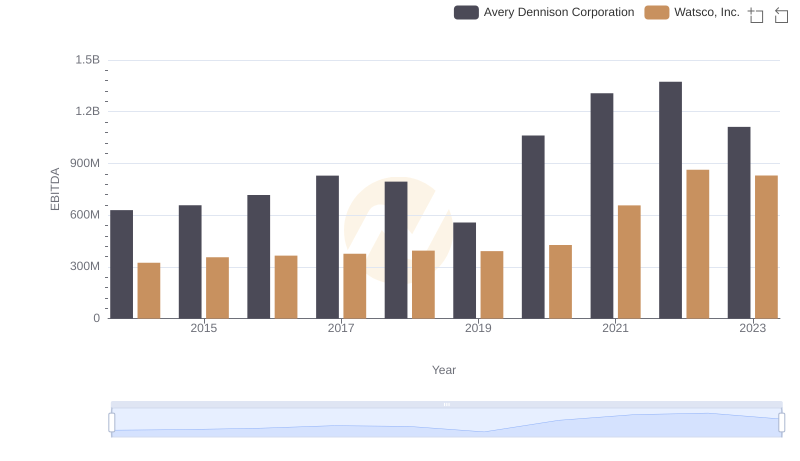
A Professional Review of EBITDA: Watsco, Inc. Compared to Avery Dennison Corporation
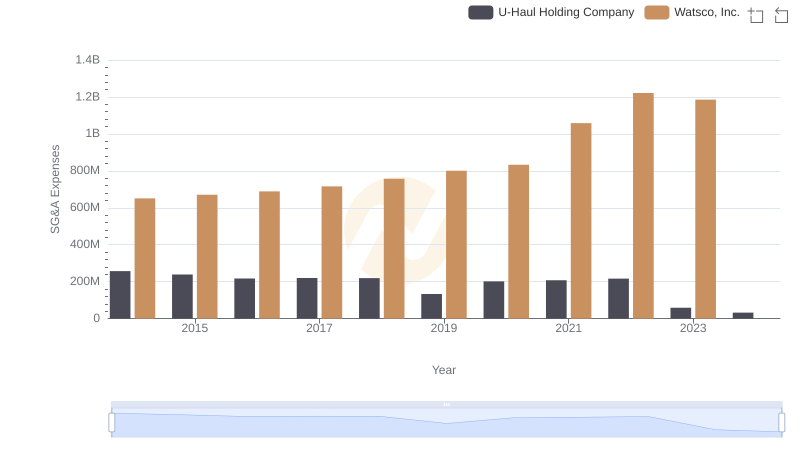
Who Optimizes SG&A Costs Better? Watsco, Inc. or U-Haul Holding Company
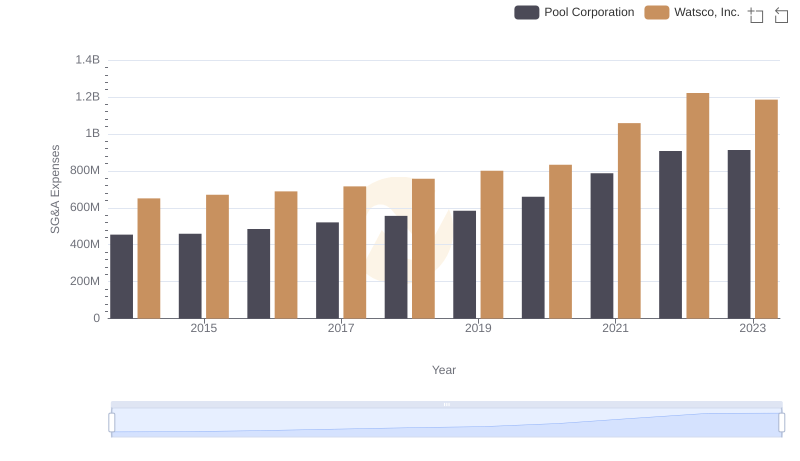
Breaking Down SG&A Expenses: Watsco, Inc. vs Pool Corporation