| __timestamp | U-Haul Holding Company | Watsco, Inc. |
|---|---|---|
| Wednesday, January 1, 2014 | 257168000 | 650655000 |
| Thursday, January 1, 2015 | 238558000 | 670609000 |
| Friday, January 1, 2016 | 217216000 | 688952000 |
| Sunday, January 1, 2017 | 220053000 | 715671000 |
| Monday, January 1, 2018 | 219271000 | 757452000 |
| Tuesday, January 1, 2019 | 133435000 | 800328000 |
| Wednesday, January 1, 2020 | 201718000 | 833051000 |
| Friday, January 1, 2021 | 207982000 | 1058316000 |
| Saturday, January 1, 2022 | 216557000 | 1221382000 |
| Sunday, January 1, 2023 | 58753000 | 1185626000 |
| Monday, January 1, 2024 | 32654000 | 1262938000 |
Unleashing insights
In the competitive landscape of corporate America, managing Selling, General, and Administrative (SG&A) expenses is crucial for profitability. Watsco, Inc. and U-Haul Holding Company, two industry giants, have shown contrasting trends in their SG&A expenses over the past decade.
From 2014 to 2023, Watsco, Inc. has seen a consistent increase in SG&A expenses, peaking in 2022 with a 88% rise from 2014. This upward trend reflects the company's expansion efforts and market penetration strategies.
Conversely, U-Haul's SG&A expenses have fluctuated, with a notable 77% decrease from 2014 to 2023. This reduction suggests a strategic focus on cost optimization and operational efficiency.
While Watsco's growth strategy is evident, U-Haul's cost-cutting measures highlight its commitment to lean operations. The missing data for 2024 suggests ongoing adjustments in their financial strategies.
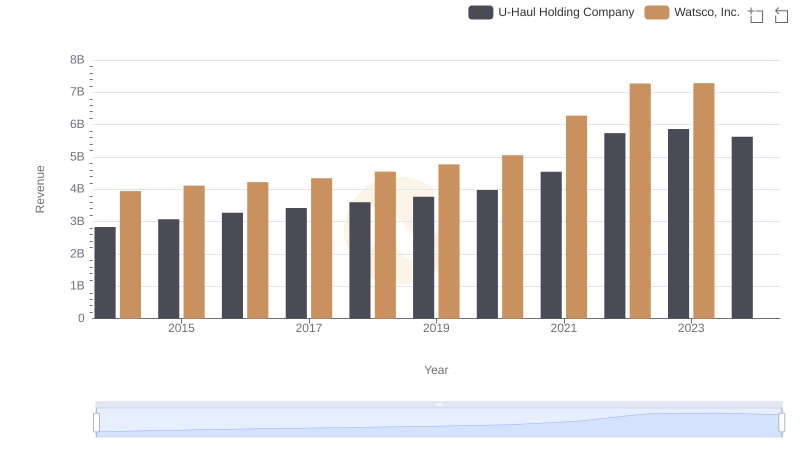
Revenue Showdown: Watsco, Inc. vs U-Haul Holding Company
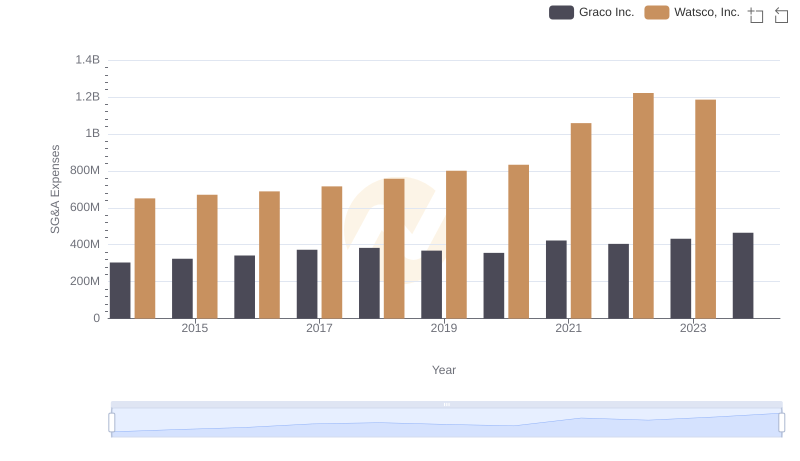
Watsco, Inc. or Graco Inc.: Who Manages SG&A Costs Better?
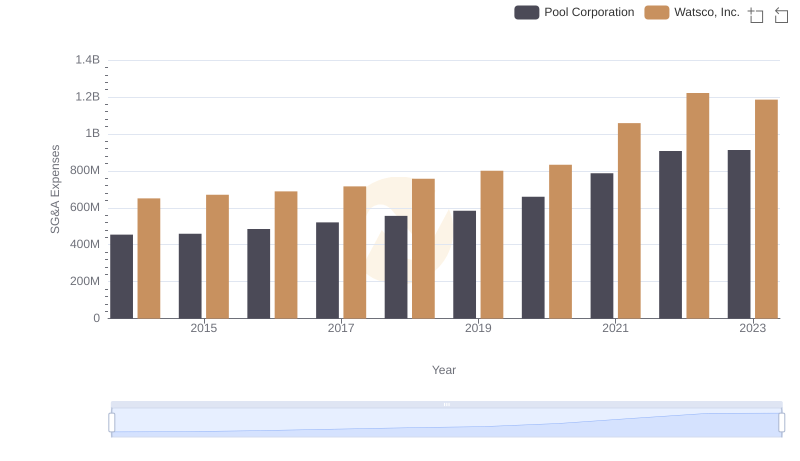
Breaking Down SG&A Expenses: Watsco, Inc. vs Pool Corporation
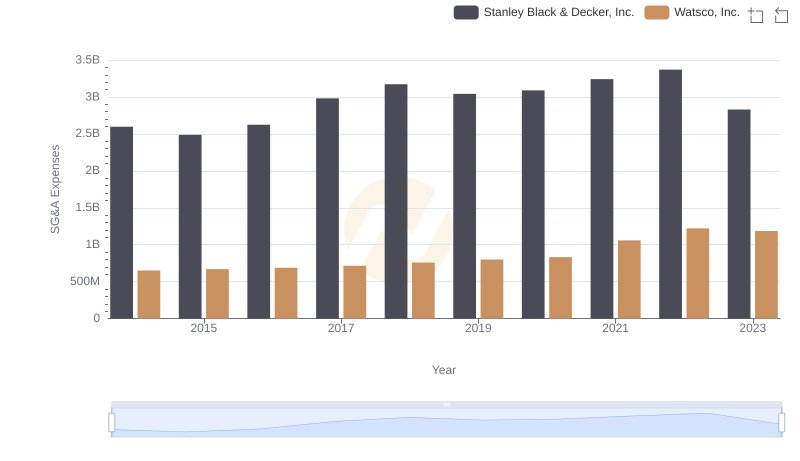
Cost Management Insights: SG&A Expenses for Watsco, Inc. and Stanley Black & Decker, Inc.
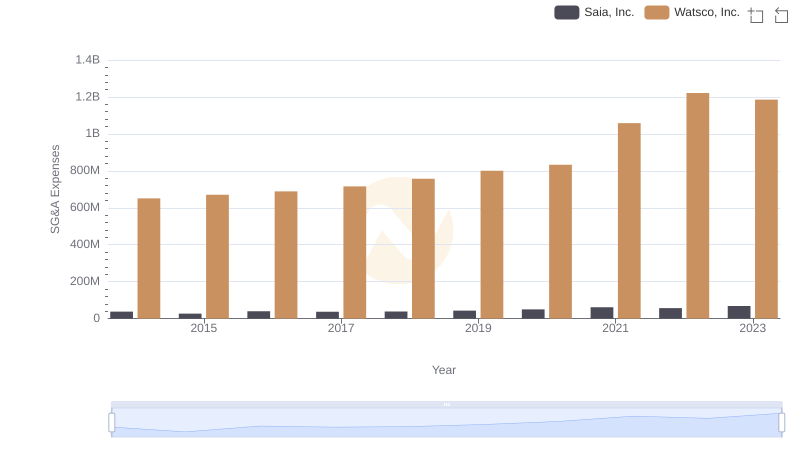
Breaking Down SG&A Expenses: Watsco, Inc. vs Saia, Inc.
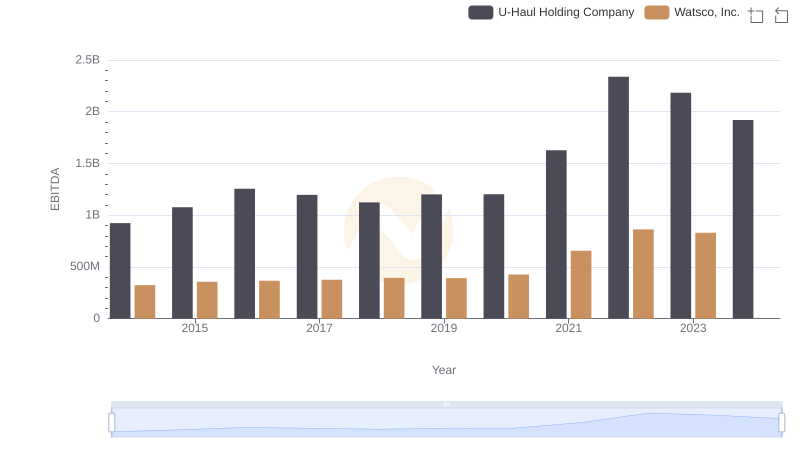
EBITDA Metrics Evaluated: Watsco, Inc. vs U-Haul Holding Company