| __timestamp | Pool Corporation | Watsco, Inc. |
|---|---|---|
| Wednesday, January 1, 2014 | 454470000 | 650655000 |
| Thursday, January 1, 2015 | 459422000 | 670609000 |
| Friday, January 1, 2016 | 485228000 | 688952000 |
| Sunday, January 1, 2017 | 520918000 | 715671000 |
| Monday, January 1, 2018 | 556284000 | 757452000 |
| Tuesday, January 1, 2019 | 583679000 | 800328000 |
| Wednesday, January 1, 2020 | 659931000 | 833051000 |
| Friday, January 1, 2021 | 786808000 | 1058316000 |
| Saturday, January 1, 2022 | 907629000 | 1221382000 |
| Sunday, January 1, 2023 | 912927000 | 1185626000 |
| Monday, January 1, 2024 | 1262938000 |
Igniting the spark of knowledge
In the competitive landscape of the HVAC and pool supply industries, understanding the financial dynamics is crucial. Over the past decade, Watsco, Inc. and Pool Corporation have shown distinct trends in their Selling, General, and Administrative (SG&A) expenses. From 2014 to 2023, Watsco, Inc. consistently outpaced Pool Corporation in SG&A spending, peaking in 2022 with a 22% higher expenditure. This trend highlights Watsco's aggressive investment in operational activities, possibly reflecting a strategy to capture market share or enhance service delivery. Meanwhile, Pool Corporation's expenses grew steadily, with a notable 100% increase from 2014 to 2023, indicating a balanced approach to scaling operations. These insights provide a window into the strategic priorities of these industry leaders, offering valuable lessons for stakeholders and investors alike.
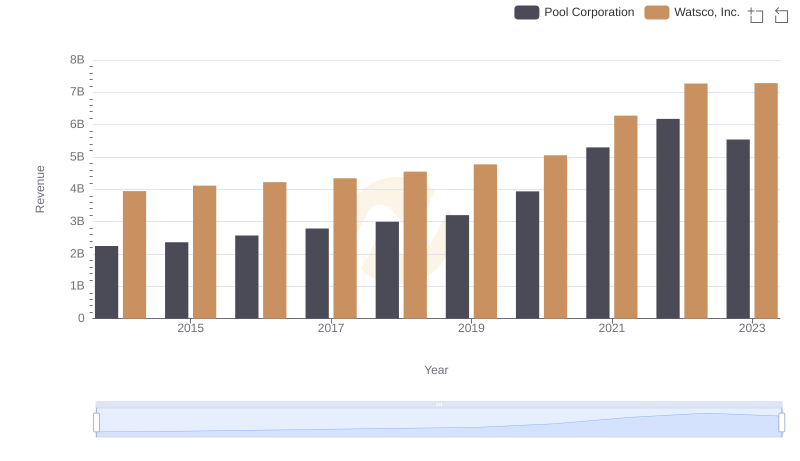
Watsco, Inc. vs Pool Corporation: Annual Revenue Growth Compared
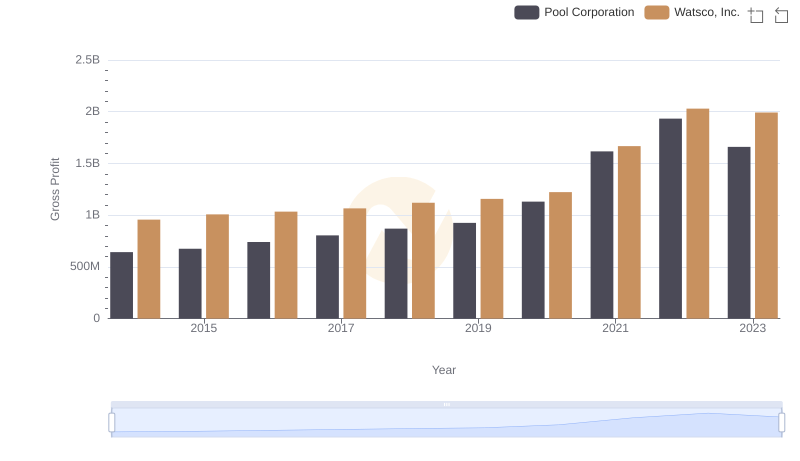
Watsco, Inc. and Pool Corporation: A Detailed Gross Profit Analysis
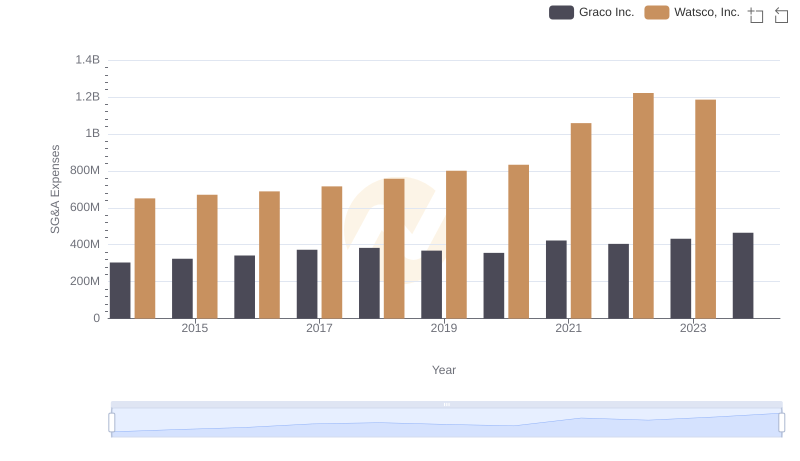
Watsco, Inc. or Graco Inc.: Who Manages SG&A Costs Better?
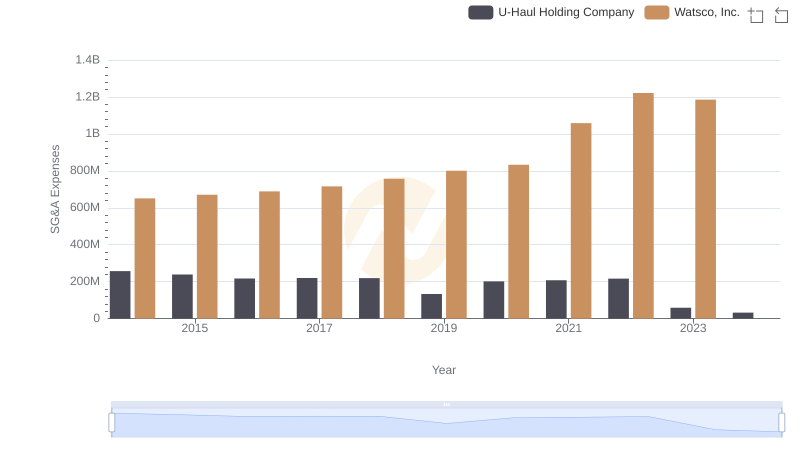
Who Optimizes SG&A Costs Better? Watsco, Inc. or U-Haul Holding Company
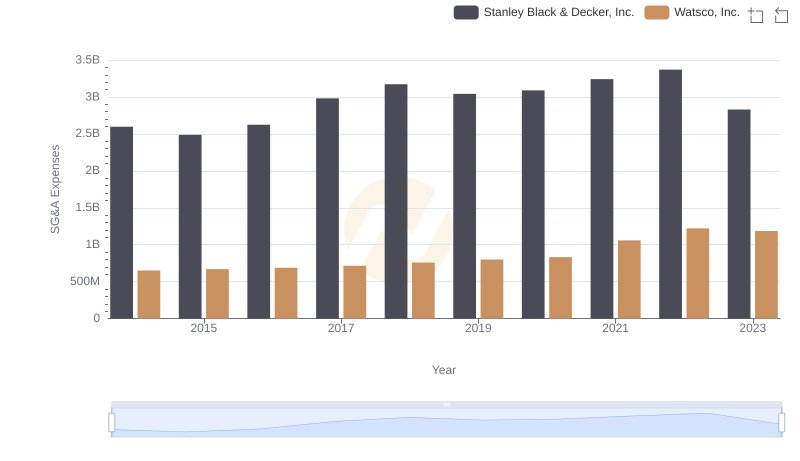
Cost Management Insights: SG&A Expenses for Watsco, Inc. and Stanley Black & Decker, Inc.
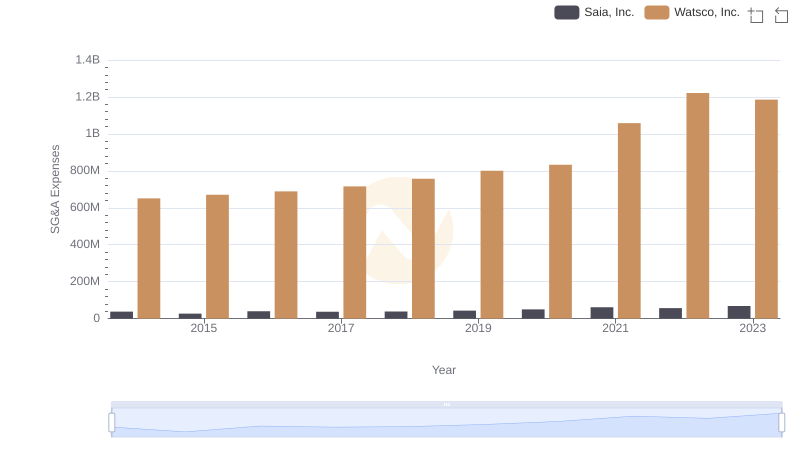
Breaking Down SG&A Expenses: Watsco, Inc. vs Saia, Inc.