| __timestamp | Ferguson plc | Waste Connections, Inc. |
|---|---|---|
| Wednesday, January 1, 2014 | 22198928094 | 2079166000 |
| Thursday, January 1, 2015 | 20800698973 | 2117287000 |
| Friday, January 1, 2016 | 19066872795 | 3375863000 |
| Sunday, January 1, 2017 | 20009463224 | 4630488000 |
| Monday, January 1, 2018 | 20752000000 | 4922941000 |
| Tuesday, January 1, 2019 | 22010000000 | 5388679000 |
| Wednesday, January 1, 2020 | 21819000000 | 5445990000 |
| Friday, January 1, 2021 | 22792000000 | 6151361000 |
| Saturday, January 1, 2022 | 28566000000 | 7211859000 |
| Sunday, January 1, 2023 | 29734000000 | 8021951000 |
| Monday, January 1, 2024 | 29635000000 | 8919591000 |
Infusing magic into the data realm
In the ever-evolving landscape of global business, understanding revenue trends is crucial. This analysis pits Waste Connections, Inc. against Ferguson plc, two giants in their respective industries, to see who has been leading the revenue race over the past decade.
From 2014 to 2023, Ferguson plc consistently outperformed Waste Connections, Inc., with revenues peaking at approximately $29.7 billion in 2023, marking a 34% increase from 2014. In contrast, Waste Connections, Inc. saw a robust growth of 286% over the same period, reaching around $8 billion in 2023.
While Ferguson plc's revenue growth is steady, Waste Connections, Inc. shows a more dynamic upward trajectory, reflecting its aggressive expansion strategy. However, data for 2024 is incomplete, leaving room for speculation on future trends. This comparison highlights the diverse strategies and market positions of these two industry leaders.
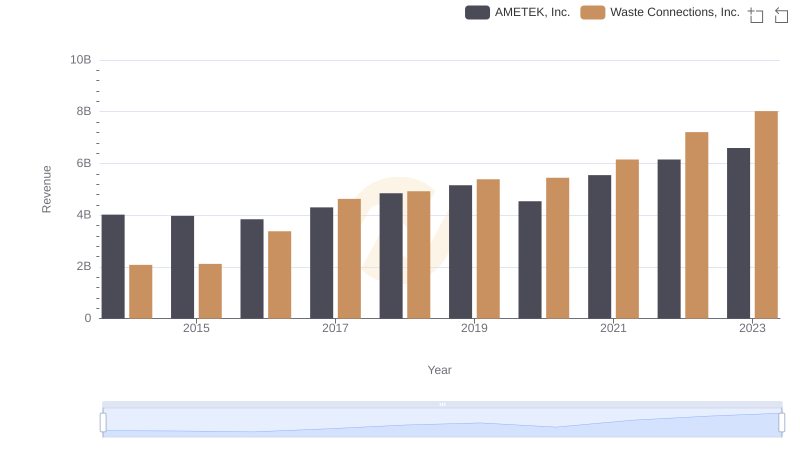
Revenue Insights: Waste Connections, Inc. and AMETEK, Inc. Performance Compared
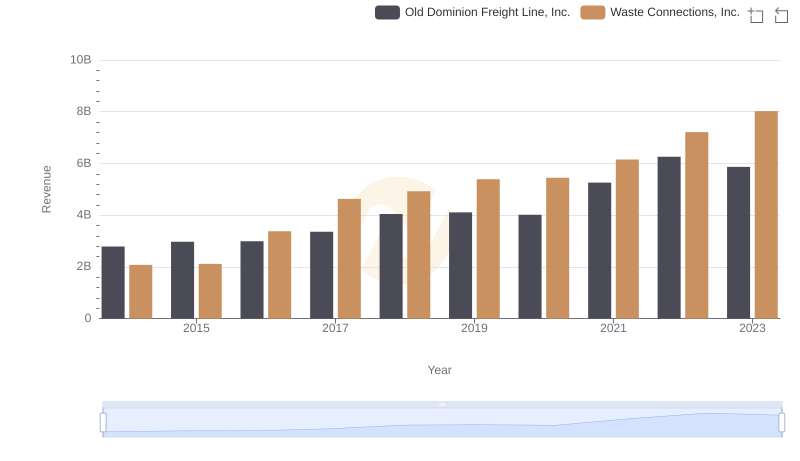
Waste Connections, Inc. and Old Dominion Freight Line, Inc.: A Comprehensive Revenue Analysis
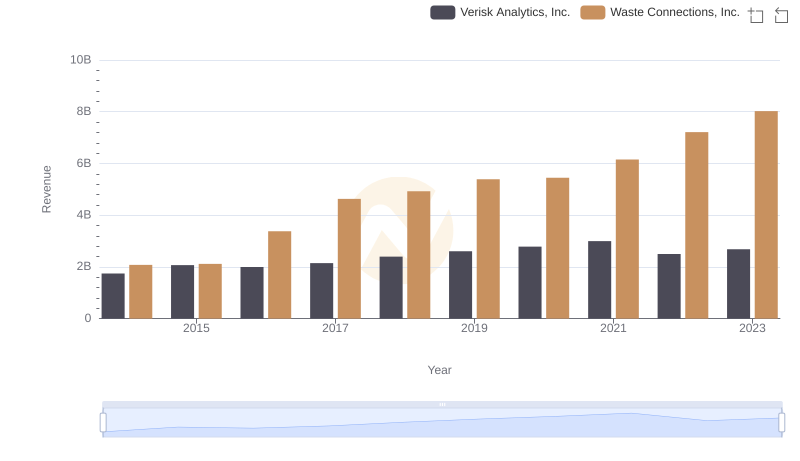
Revenue Showdown: Waste Connections, Inc. vs Verisk Analytics, Inc.
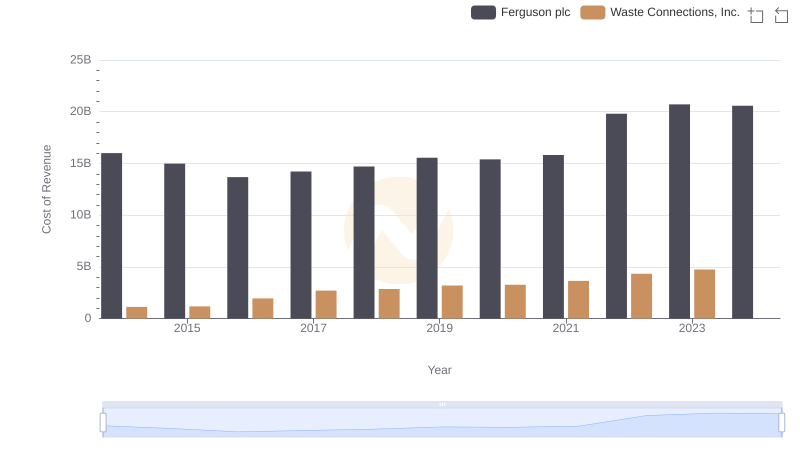
Cost of Revenue Comparison: Waste Connections, Inc. vs Ferguson plc
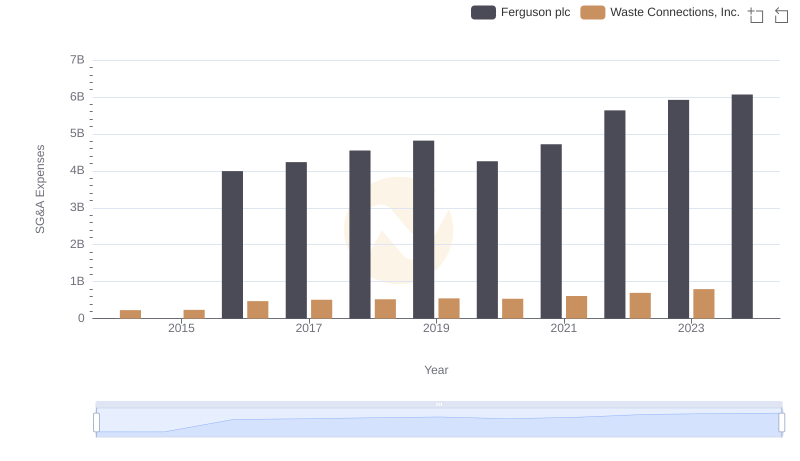
Waste Connections, Inc. or Ferguson plc: Who Manages SG&A Costs Better?

EBITDA Metrics Evaluated: Waste Connections, Inc. vs Ferguson plc