| __timestamp | Carlisle Companies Incorporated | Union Pacific Corporation |
|---|---|---|
| Wednesday, January 1, 2014 | 512300000 | 10808000000 |
| Thursday, January 1, 2015 | 631900000 | 10290000000 |
| Friday, January 1, 2016 | 580200000 | 9502000000 |
| Sunday, January 1, 2017 | 609300000 | 10456000000 |
| Monday, January 1, 2018 | 696100000 | 10802000000 |
| Tuesday, January 1, 2019 | 851000000 | 11013000000 |
| Wednesday, January 1, 2020 | 733100000 | 10331000000 |
| Friday, January 1, 2021 | 816100000 | 11843000000 |
| Saturday, January 1, 2022 | 1483400000 | 12636000000 |
| Sunday, January 1, 2023 | 1210700000 | 11928000000 |
| Monday, January 1, 2024 | 1356800000 | 12461000000 |
Igniting the spark of knowledge
In the ever-evolving landscape of American industry, Union Pacific Corporation and Carlisle Companies Incorporated stand as titans in their respective fields. Over the past decade, Union Pacific has consistently demonstrated robust financial health, with its EBITDA peaking at approximately $12.6 billion in 2022, marking a 33% increase from 2016. Meanwhile, Carlisle Companies has shown impressive growth, with its EBITDA nearly tripling from 2014 to 2022, reaching around $1.48 billion.
This side-by-side analysis reveals Union Pacific's dominance in scale, yet highlights Carlisle's remarkable growth trajectory. The data from 2014 to 2023 underscores the resilience and adaptability of these corporations, even amidst economic fluctuations. Notably, 2024 data for Carlisle is missing, leaving room for speculation on its future performance. As these companies continue to navigate the complexities of their industries, their financial strategies remain a focal point for investors and analysts alike.
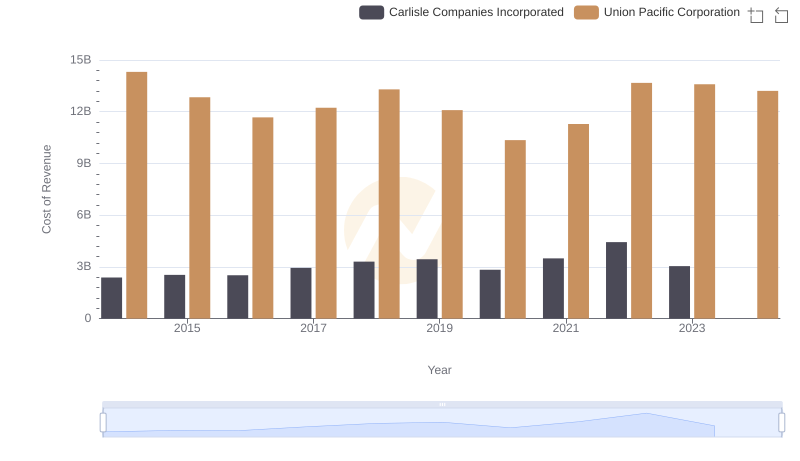
Cost of Revenue Trends: Union Pacific Corporation vs Carlisle Companies Incorporated
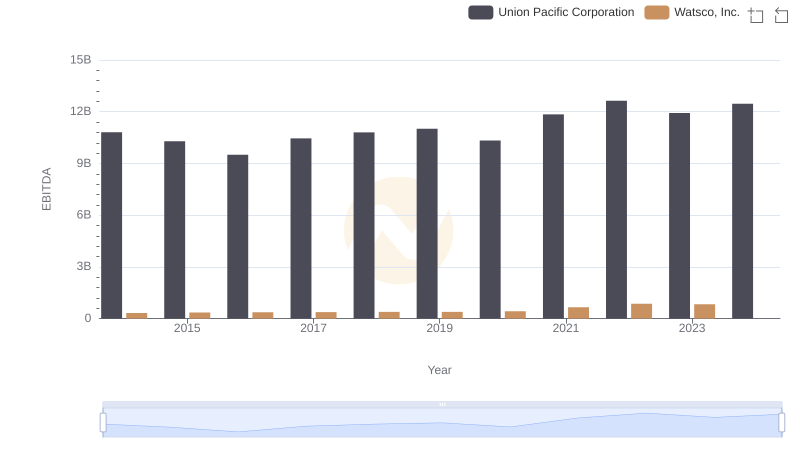
Comparative EBITDA Analysis: Union Pacific Corporation vs Watsco, Inc.
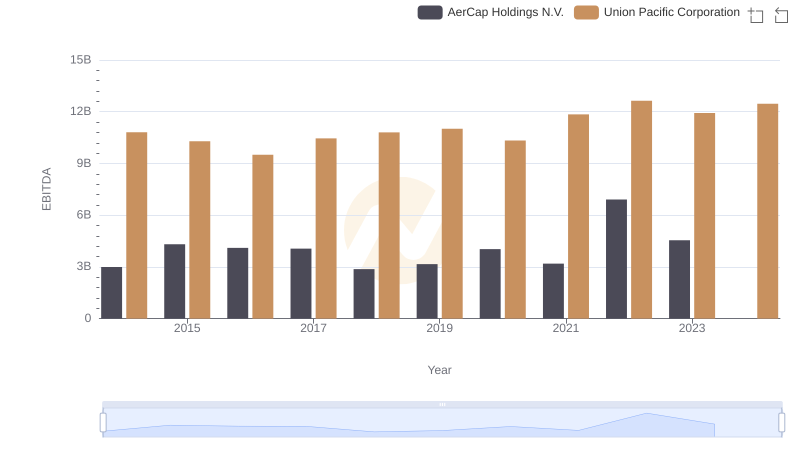
Comparative EBITDA Analysis: Union Pacific Corporation vs AerCap Holdings N.V.
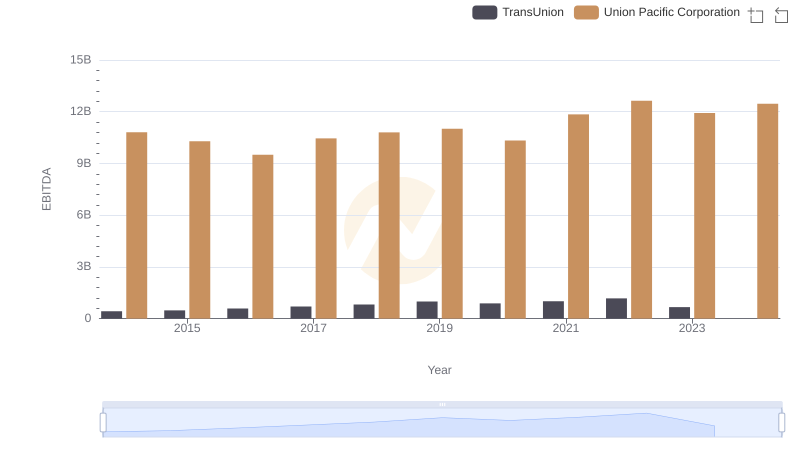
EBITDA Analysis: Evaluating Union Pacific Corporation Against TransUnion
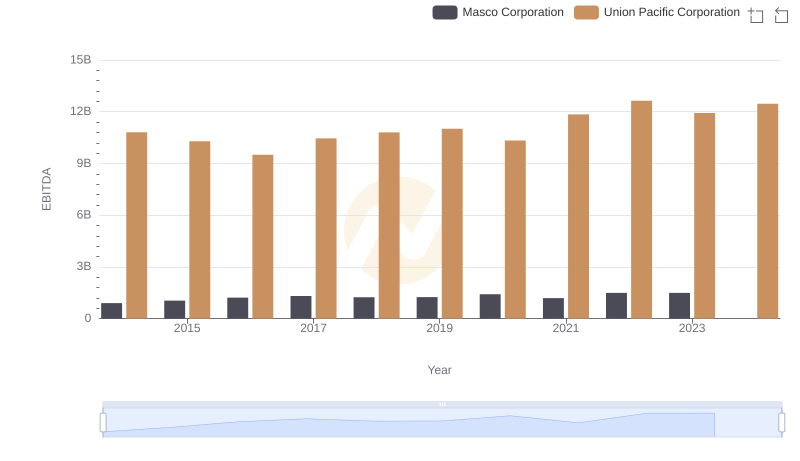
A Professional Review of EBITDA: Union Pacific Corporation Compared to Masco Corporation
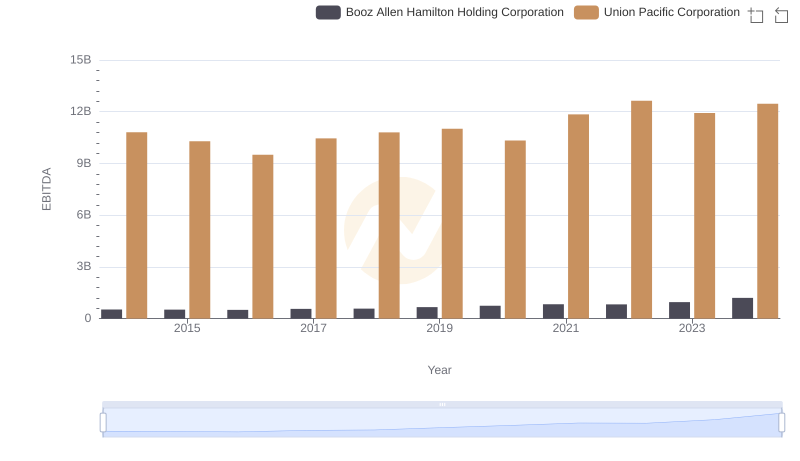
A Side-by-Side Analysis of EBITDA: Union Pacific Corporation and Booz Allen Hamilton Holding Corporation