| __timestamp | AerCap Holdings N.V. | Union Pacific Corporation |
|---|---|---|
| Wednesday, January 1, 2014 | 2997442000 | 10808000000 |
| Thursday, January 1, 2015 | 4313510000 | 10290000000 |
| Friday, January 1, 2016 | 4101801000 | 9502000000 |
| Sunday, January 1, 2017 | 4061381000 | 10456000000 |
| Monday, January 1, 2018 | 2874193000 | 10802000000 |
| Tuesday, January 1, 2019 | 3157061000 | 11013000000 |
| Wednesday, January 1, 2020 | 4028661000 | 10331000000 |
| Friday, January 1, 2021 | 3192341000 | 11843000000 |
| Saturday, January 1, 2022 | 6911148000 | 12636000000 |
| Sunday, January 1, 2023 | 4547656000 | 11928000000 |
| Monday, January 1, 2024 | 12461000000 |
Unleashing insights
In the ever-evolving landscape of global commerce, Union Pacific Corporation and AerCap Holdings N.V. stand as titans in their respective industries. Over the past decade, Union Pacific, a leader in rail transportation, consistently outperformed AerCap, a major player in aircraft leasing, in terms of EBITDA. From 2014 to 2023, Union Pacific's EBITDA grew by approximately 11%, peaking in 2022 with a 15% increase from 2021. Meanwhile, AerCap experienced a significant surge in 2022, with EBITDA nearly doubling from the previous year, highlighting its resilience and adaptability in a volatile market. However, 2023 saw a slight decline for AerCap, indicating potential challenges ahead. This comparative analysis not only underscores the financial robustness of these corporations but also reflects broader economic trends impacting transportation and aviation sectors. Missing data for 2024 suggests a need for cautious optimism as both companies navigate future uncertainties.
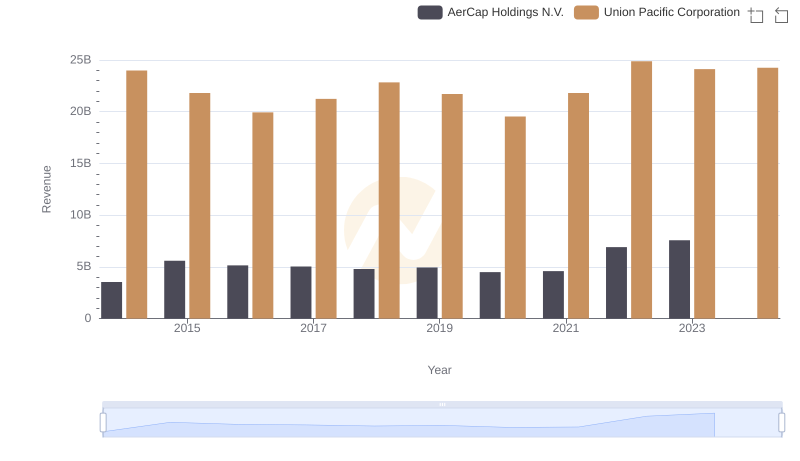
Union Pacific Corporation or AerCap Holdings N.V.: Who Leads in Yearly Revenue?
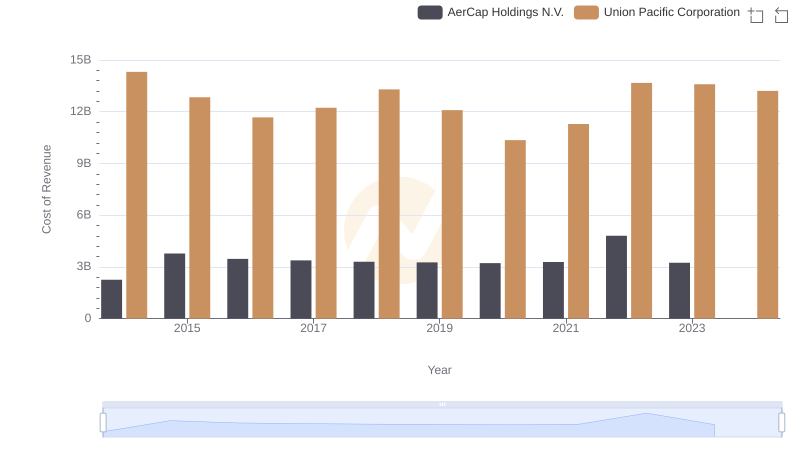
Analyzing Cost of Revenue: Union Pacific Corporation and AerCap Holdings N.V.
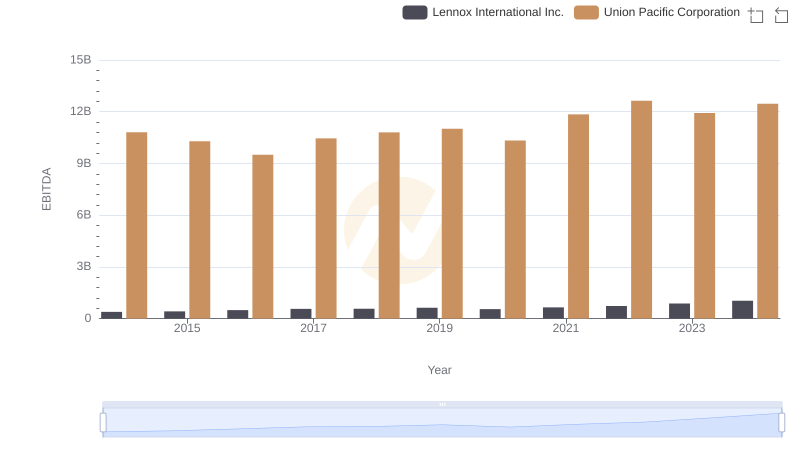
Union Pacific Corporation and Lennox International Inc.: A Detailed Examination of EBITDA Performance
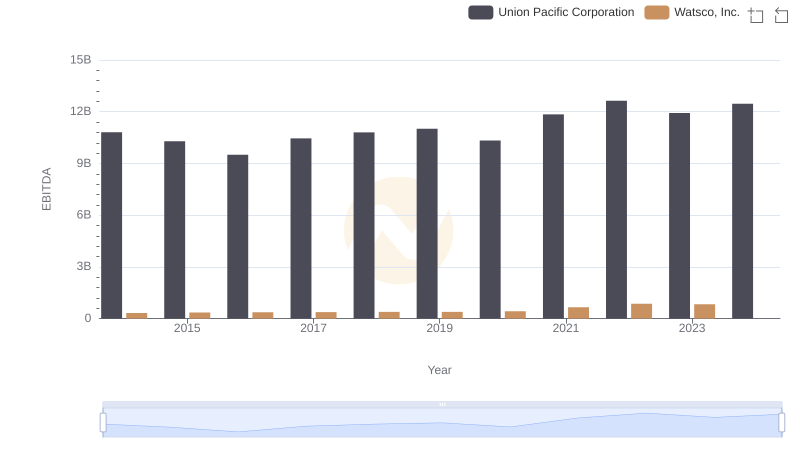
Comparative EBITDA Analysis: Union Pacific Corporation vs Watsco, Inc.
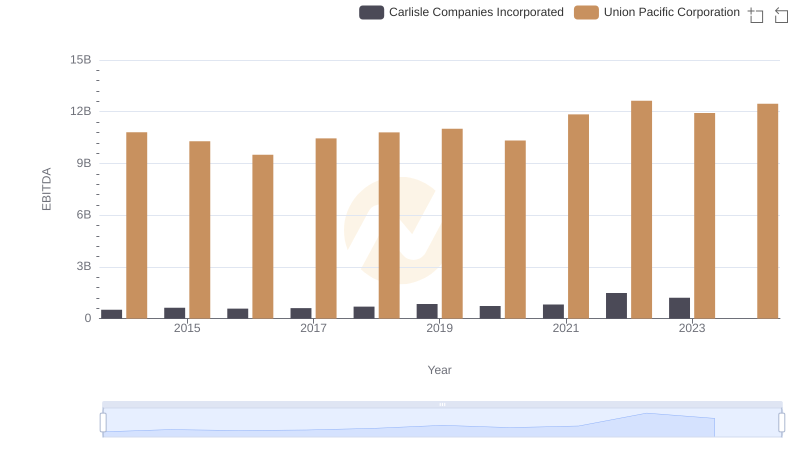
A Side-by-Side Analysis of EBITDA: Union Pacific Corporation and Carlisle Companies Incorporated
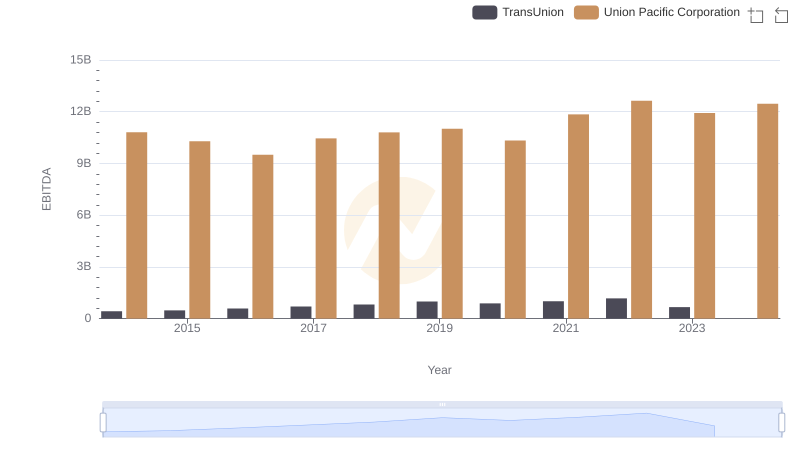
EBITDA Analysis: Evaluating Union Pacific Corporation Against TransUnion
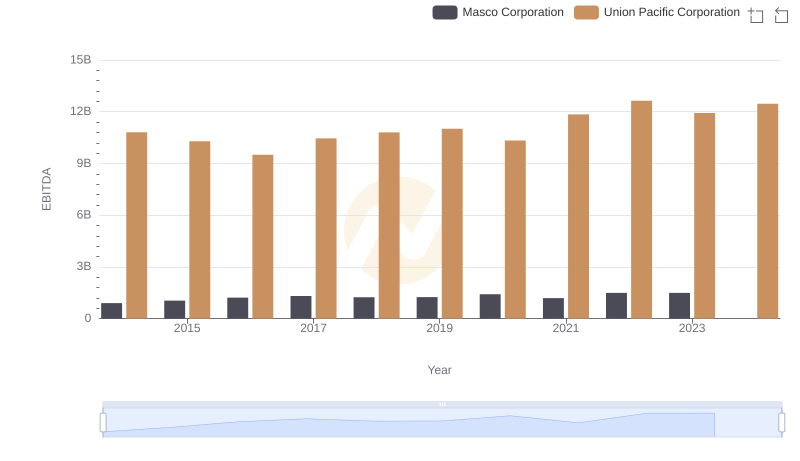
A Professional Review of EBITDA: Union Pacific Corporation Compared to Masco Corporation