| __timestamp | PACCAR Inc | Trane Technologies plc |
|---|---|---|
| Wednesday, January 1, 2014 | 18997000000 | 12891400000 |
| Thursday, January 1, 2015 | 19115100000 | 13300700000 |
| Friday, January 1, 2016 | 17033300000 | 13508900000 |
| Sunday, January 1, 2017 | 19456400000 | 14197600000 |
| Monday, January 1, 2018 | 23495700000 | 15668200000 |
| Tuesday, January 1, 2019 | 25599700000 | 16598900000 |
| Wednesday, January 1, 2020 | 18728500000 | 12454700000 |
| Friday, January 1, 2021 | 23522300000 | 14136400000 |
| Saturday, January 1, 2022 | 28819700000 | 15991700000 |
| Sunday, January 1, 2023 | 35127400000 | 17677600000 |
| Monday, January 1, 2024 | 31564300000 | 19838200000 |
Data in motion
In the competitive landscape of industrial manufacturing, Trane Technologies plc and PACCAR Inc have showcased remarkable revenue trajectories over the past decade. Since 2014, PACCAR Inc has consistently outperformed, with a staggering 85% increase in revenue by 2023. This growth is highlighted by a peak in 2023, where PACCAR's revenue reached an impressive 35 billion USD, marking a significant leap from its 2014 figures.
Trane Technologies, while trailing behind PACCAR, has demonstrated steady growth, achieving a 37% increase in revenue from 2014 to 2023. Notably, Trane's revenue peaked in 2023 at approximately 18 billion USD. However, data for 2024 remains incomplete, leaving room for speculation on future trends.
This analysis underscores the dynamic nature of the industrial sector, where strategic innovation and market adaptation are key to sustaining growth.
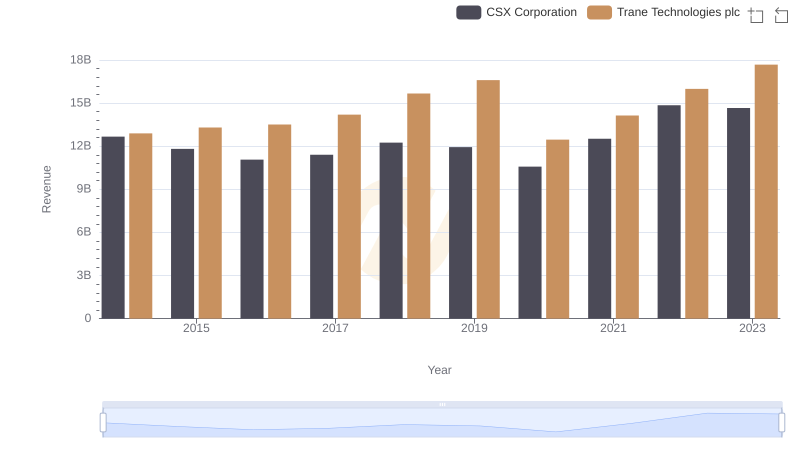
Breaking Down Revenue Trends: Trane Technologies plc vs CSX Corporation
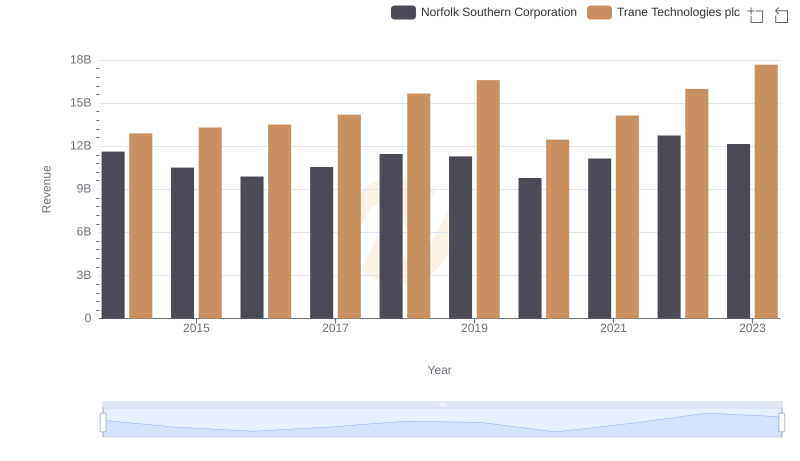
Trane Technologies plc and Norfolk Southern Corporation: A Comprehensive Revenue Analysis
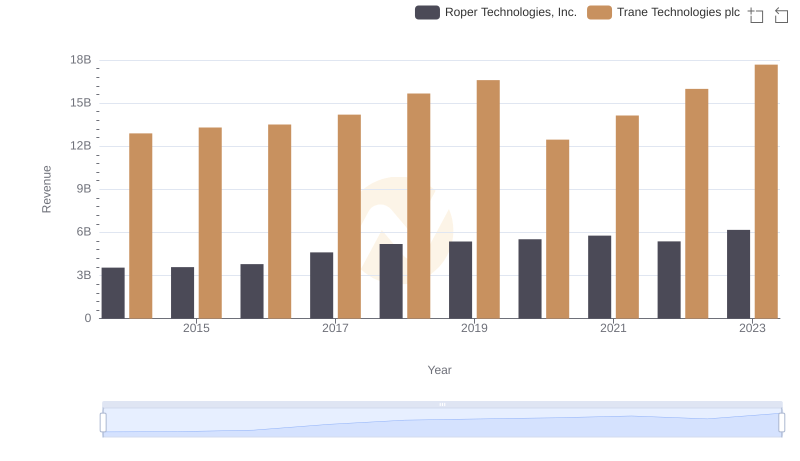
Trane Technologies plc vs Roper Technologies, Inc.: Examining Key Revenue Metrics
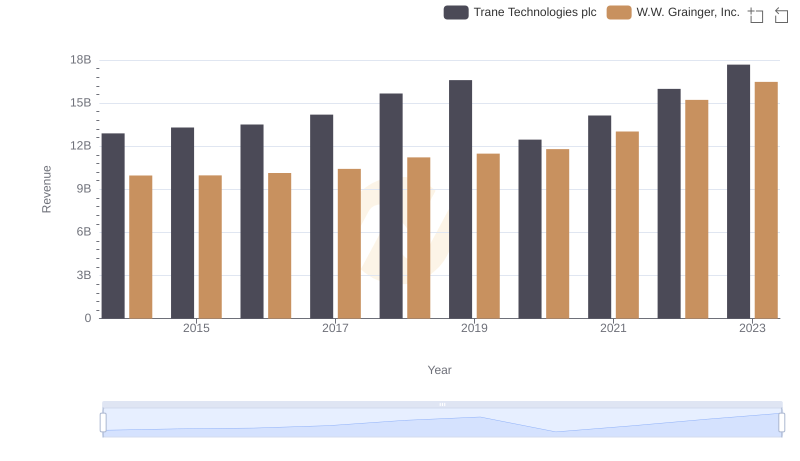
Annual Revenue Comparison: Trane Technologies plc vs W.W. Grainger, Inc.
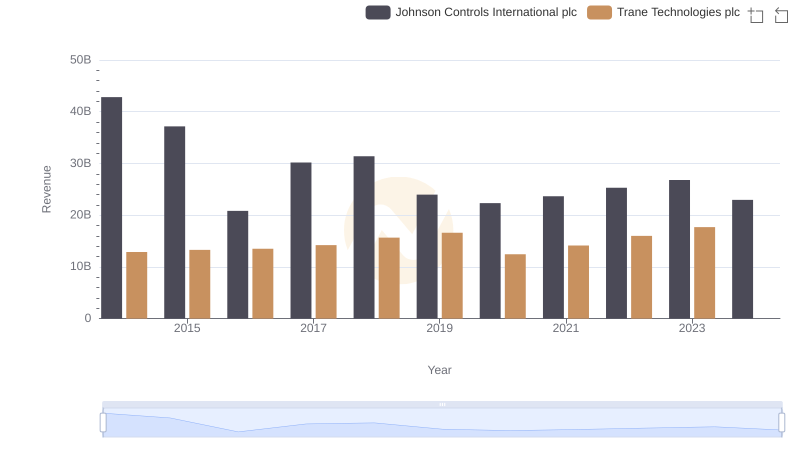
Revenue Insights: Trane Technologies plc and Johnson Controls International plc Performance Compared
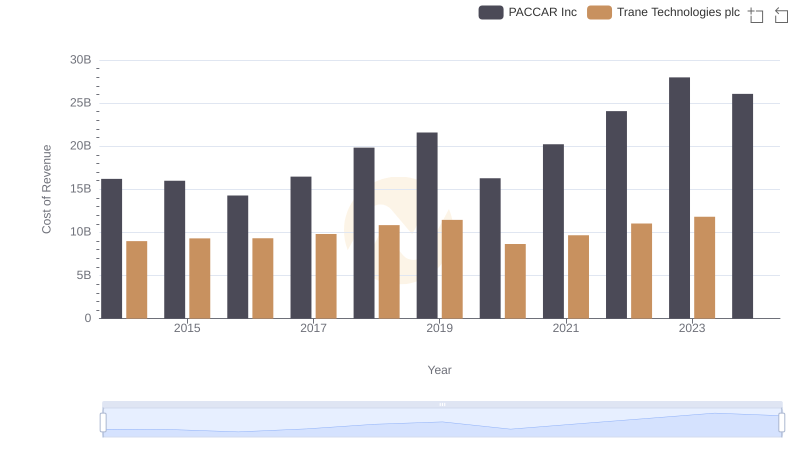
Cost Insights: Breaking Down Trane Technologies plc and PACCAR Inc's Expenses
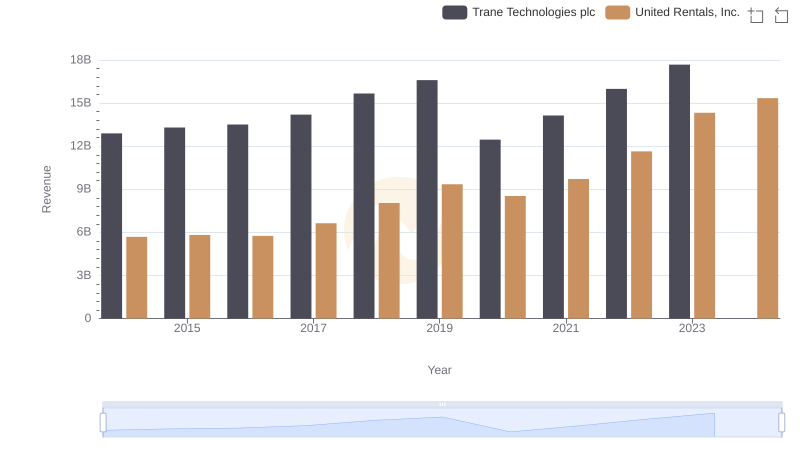
Who Generates More Revenue? Trane Technologies plc or United Rentals, Inc.
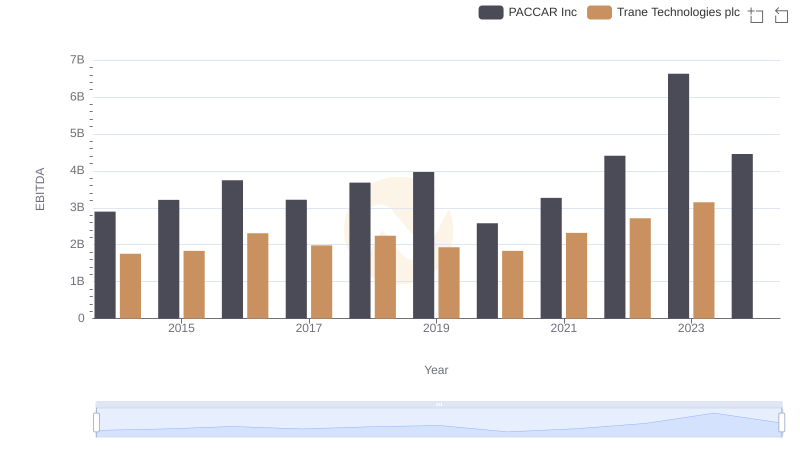
Trane Technologies plc vs PACCAR Inc: In-Depth EBITDA Performance Comparison