| __timestamp | Textron Inc. | The Boeing Company |
|---|---|---|
| Wednesday, January 1, 2014 | 13878000000 | 90762000000 |
| Thursday, January 1, 2015 | 13423000000 | 96114000000 |
| Friday, January 1, 2016 | 13788000000 | 94571000000 |
| Sunday, January 1, 2017 | 14198000000 | 93392000000 |
| Monday, January 1, 2018 | 13972000000 | 101127000000 |
| Tuesday, January 1, 2019 | 13630000000 | 76559000000 |
| Wednesday, January 1, 2020 | 11651000000 | 58158000000 |
| Friday, January 1, 2021 | 12382000000 | 62286000000 |
| Saturday, January 1, 2022 | 12869000000 | 66608000000 |
| Sunday, January 1, 2023 | 13683000000 | 77794000000 |
| Monday, January 1, 2024 | 13702000000 | 66517000000 |
Unlocking the unknown
In the ever-evolving aerospace industry, The Boeing Company and Textron Inc. have been pivotal players. Over the past decade, Boeing's revenue has seen a rollercoaster ride, peaking in 2018 with a staggering 101 billion dollars, only to dip by nearly 43% in 2020. This decline was largely due to the global pandemic and its impact on air travel. However, Boeing has shown resilience, with a 34% revenue increase by 2023.
Textron, on the other hand, has maintained a more stable trajectory. Despite a slight dip in 2020, their revenue has consistently hovered around the 13 billion dollar mark, showcasing a steady growth pattern. By 2023, Textron's revenue had increased by approximately 18% from its 2020 low.
This comparison highlights the contrasting strategies and market responses of these two aerospace titans, offering valuable insights into their financial health and adaptability.

The Boeing Company vs XPO Logistics, Inc.: Examining Key Revenue Metrics
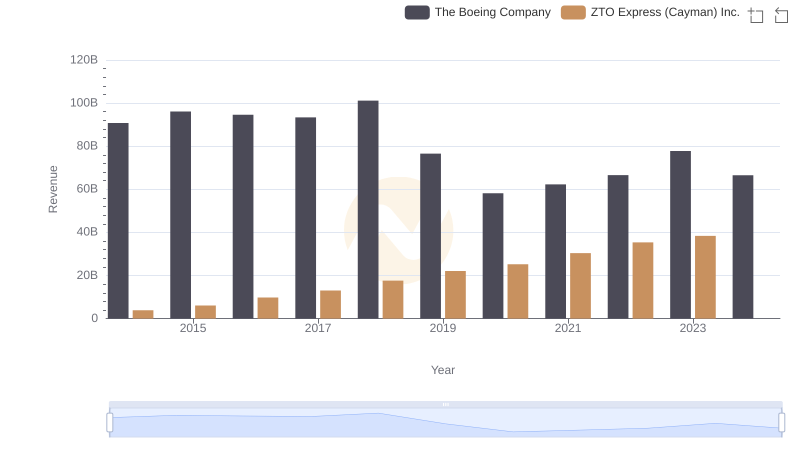
The Boeing Company or ZTO Express (Cayman) Inc.: Who Leads in Yearly Revenue?
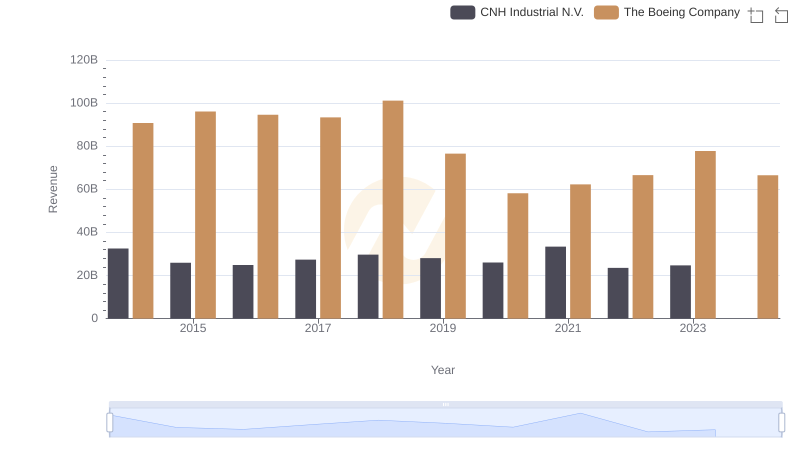
Breaking Down Revenue Trends: The Boeing Company vs CNH Industrial N.V.
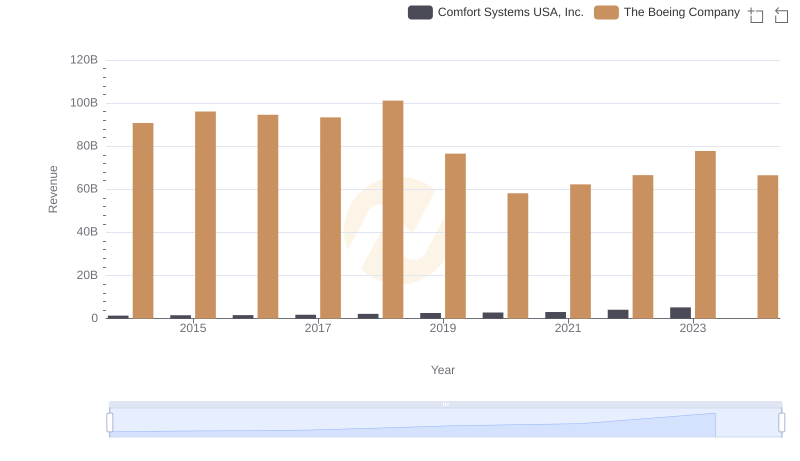
Breaking Down Revenue Trends: The Boeing Company vs Comfort Systems USA, Inc.

The Boeing Company or AECOM: Who Leads in Yearly Revenue?
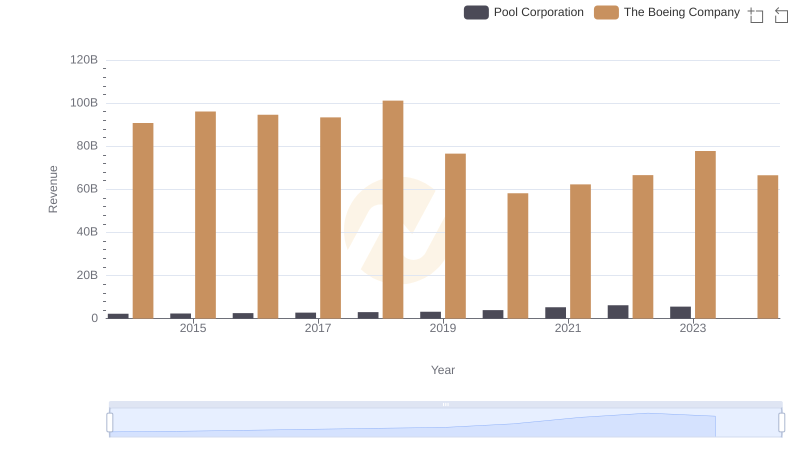
Breaking Down Revenue Trends: The Boeing Company vs Pool Corporation