| __timestamp | Owens Corning | The Boeing Company |
|---|---|---|
| Wednesday, January 1, 2014 | 5276000000 | 90762000000 |
| Thursday, January 1, 2015 | 5350000000 | 96114000000 |
| Friday, January 1, 2016 | 5677000000 | 94571000000 |
| Sunday, January 1, 2017 | 6384000000 | 93392000000 |
| Monday, January 1, 2018 | 7057000000 | 101127000000 |
| Tuesday, January 1, 2019 | 7160000000 | 76559000000 |
| Wednesday, January 1, 2020 | 7055000000 | 58158000000 |
| Friday, January 1, 2021 | 8498000000 | 62286000000 |
| Saturday, January 1, 2022 | 9761000000 | 66608000000 |
| Sunday, January 1, 2023 | 9677000000 | 77794000000 |
| Monday, January 1, 2024 | 66517000000 |
Unveiling the hidden dimensions of data
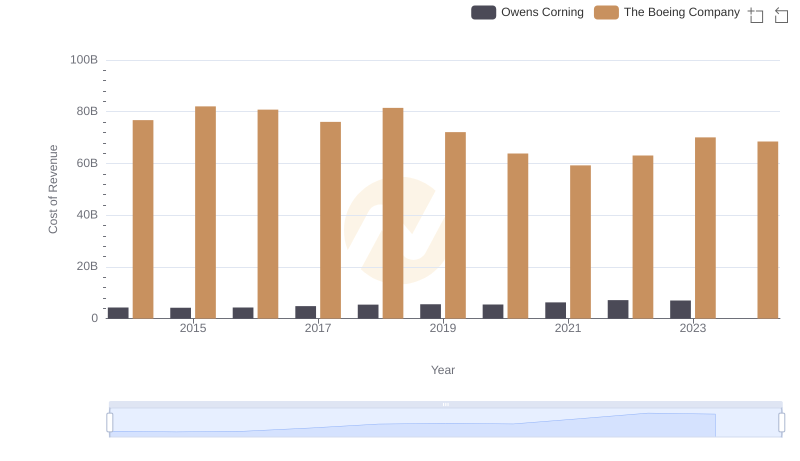
In the ever-evolving landscape of American industry, The Boeing Company and Owens Corning stand as titans in their respective fields. Over the past decade, these companies have navigated the turbulent waters of economic shifts and global challenges. From 2014 to 2023, Boeing's revenue trajectory reveals a rollercoaster ride, peaking in 2018 with a 12% increase from the previous year, only to face a significant downturn in 2019 and 2020, likely due to global disruptions. However, a recovery is evident by 2023, with revenues climbing back to nearly 78 billion dollars.
Owens Corning, on the other hand, showcases a more stable growth pattern, with revenues increasing by approximately 83% from 2014 to 2023. This steady rise underscores the company's resilience and adaptability in the building materials sector. Notably, 2024 data for Owens Corning is missing, leaving room for speculation on its future trajectory.