| __timestamp | Quanta Services, Inc. | The Boeing Company |
|---|---|---|
| Wednesday, January 1, 2014 | 7851250000 | 90762000000 |
| Thursday, January 1, 2015 | 7572436000 | 96114000000 |
| Friday, January 1, 2016 | 7651319000 | 94571000000 |
| Sunday, January 1, 2017 | 9466478000 | 93392000000 |
| Monday, January 1, 2018 | 11171423000 | 101127000000 |
| Tuesday, January 1, 2019 | 12112153000 | 76559000000 |
| Wednesday, January 1, 2020 | 11202672000 | 58158000000 |
| Friday, January 1, 2021 | 12980213000 | 62286000000 |
| Saturday, January 1, 2022 | 17073903000 | 66608000000 |
| Sunday, January 1, 2023 | 20882206000 | 77794000000 |
| Monday, January 1, 2024 | 66517000000 |
Unleashing insights
In the ever-evolving landscape of the aerospace and infrastructure sectors, The Boeing Company and Quanta Services, Inc. stand as titans. Over the past decade, Boeing's revenue trajectory has seen a rollercoaster ride, peaking in 2018 with a staggering 101 billion USD, only to dip significantly in 2020 to 58 billion USD, reflecting the global challenges faced by the aviation industry. Meanwhile, Quanta Services has steadily climbed, showcasing a remarkable growth of over 170% from 2014 to 2023, reaching a revenue of 20.9 billion USD. This growth underscores the increasing demand for infrastructure services. As we look to the future, the data for 2024 remains incomplete, leaving room for speculation and anticipation. This comparison not only highlights the resilience and adaptability of these companies but also offers a glimpse into the broader economic trends shaping their industries.
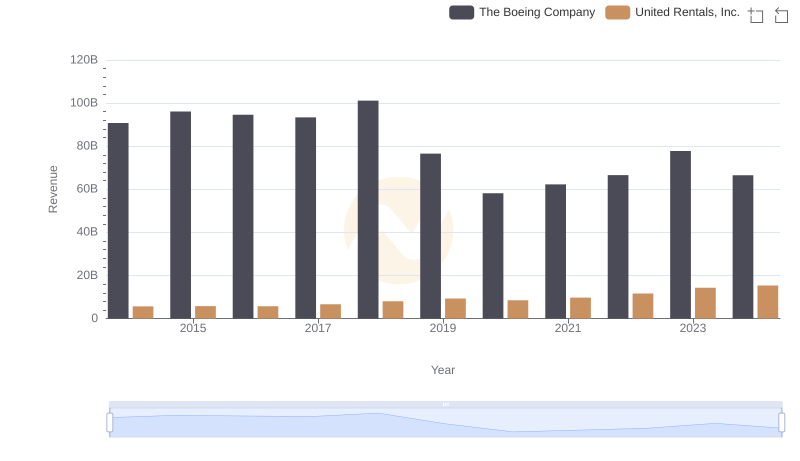
Revenue Insights: The Boeing Company and United Rentals, Inc. Performance Compared

The Boeing Company and Waste Connections, Inc.: A Comprehensive Revenue Analysis

The Boeing Company or Delta Air Lines, Inc.: Who Leads in Yearly Revenue?
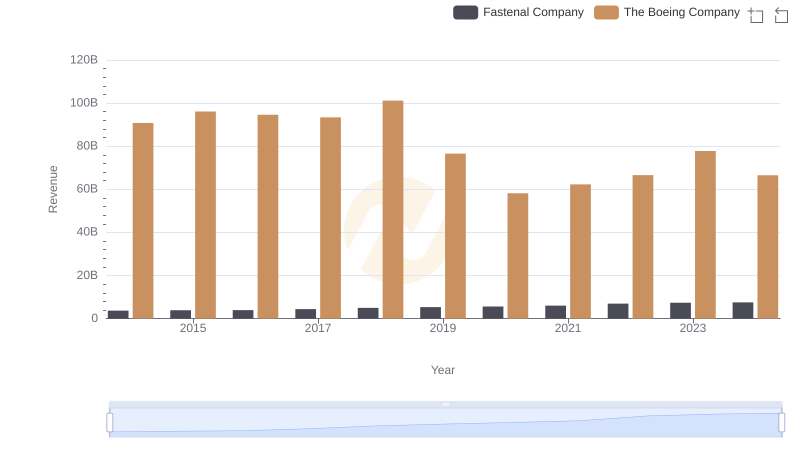
The Boeing Company and Fastenal Company: A Comprehensive Revenue Analysis
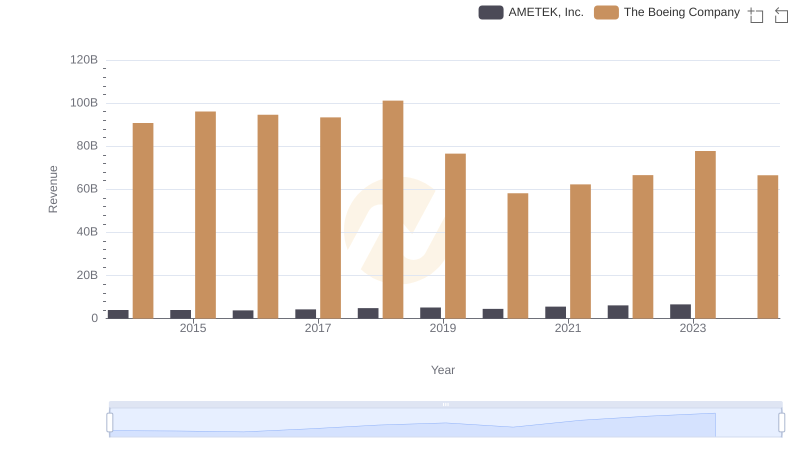
The Boeing Company and AMETEK, Inc.: A Comprehensive Revenue Analysis
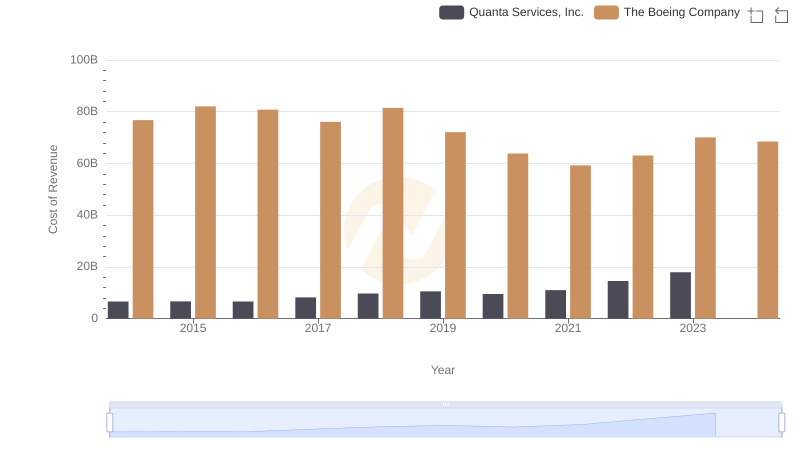
Cost Insights: Breaking Down The Boeing Company and Quanta Services, Inc.'s Expenses

Comparing SG&A Expenses: The Boeing Company vs Quanta Services, Inc. Trends and Insights