| __timestamp | The Boeing Company | TransDigm Group Incorporated |
|---|---|---|
| Wednesday, January 1, 2014 | 3767000000 | 276446000 |
| Thursday, January 1, 2015 | 3525000000 | 321624000 |
| Friday, January 1, 2016 | 3616000000 | 382858000 |
| Sunday, January 1, 2017 | 4094000000 | 415575000 |
| Monday, January 1, 2018 | 4567000000 | 450095000 |
| Tuesday, January 1, 2019 | 3909000000 | 747773000 |
| Wednesday, January 1, 2020 | 4817000000 | 727000000 |
| Friday, January 1, 2021 | 4157000000 | 685000000 |
| Saturday, January 1, 2022 | 4187000000 | 748000000 |
| Sunday, January 1, 2023 | 5168000000 | 780000000 |
| Monday, January 1, 2024 | 5021000000 | 931000000 |
Cracking the code
In the competitive aerospace industry, understanding the financial strategies of major players is crucial. Over the past decade, The Boeing Company and TransDigm Group Incorporated have shown distinct trends in their Selling, General, and Administrative (SG&A) expenses. From 2014 to 2024, Boeing's SG&A expenses have increased by approximately 33%, peaking in 2023 with a notable 5.2 billion dollars. In contrast, TransDigm's expenses have grown by about 237%, reaching nearly 931 million dollars in 2024. This stark difference highlights Boeing's larger scale of operations, while TransDigm's rapid growth reflects its aggressive expansion strategy. These trends offer valuable insights into how each company allocates resources to maintain competitiveness and drive innovation. As the aerospace sector continues to evolve, monitoring these financial patterns will be key to understanding future market dynamics.
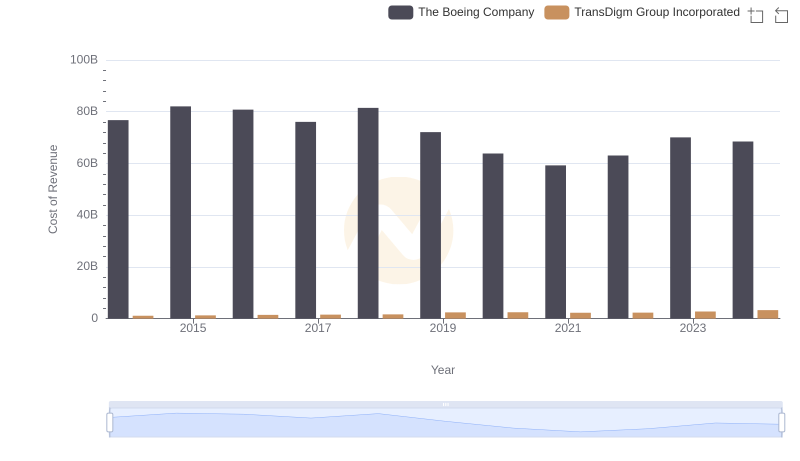
Cost of Revenue Trends: The Boeing Company vs TransDigm Group Incorporated
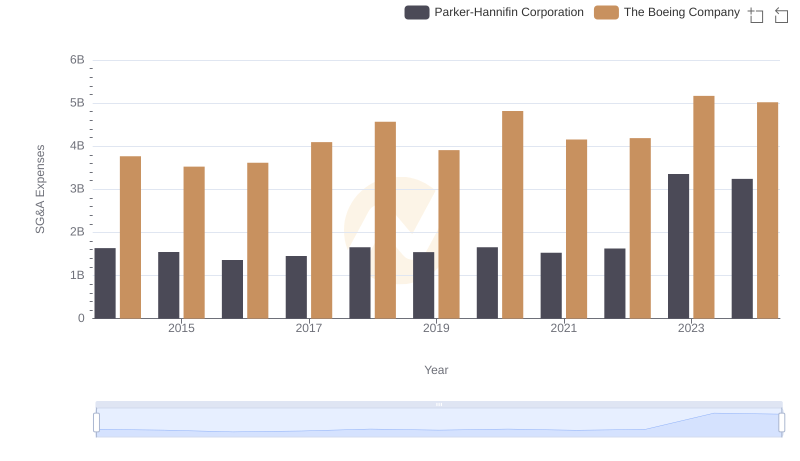
The Boeing Company and Parker-Hannifin Corporation: SG&A Spending Patterns Compared
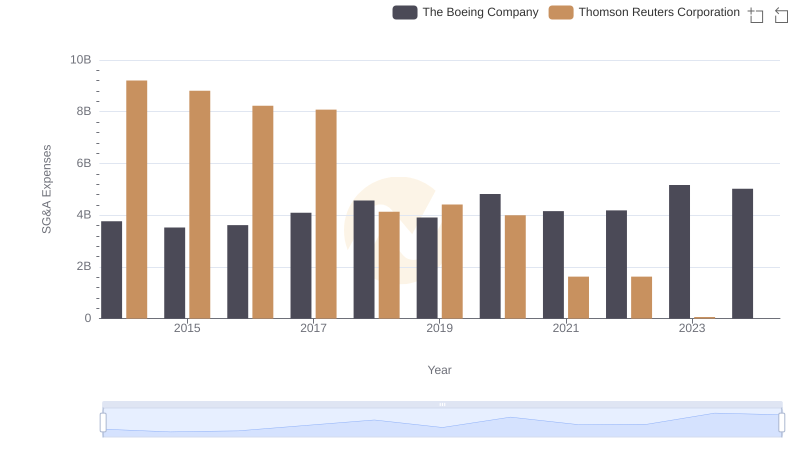
Selling, General, and Administrative Costs: The Boeing Company vs Thomson Reuters Corporation
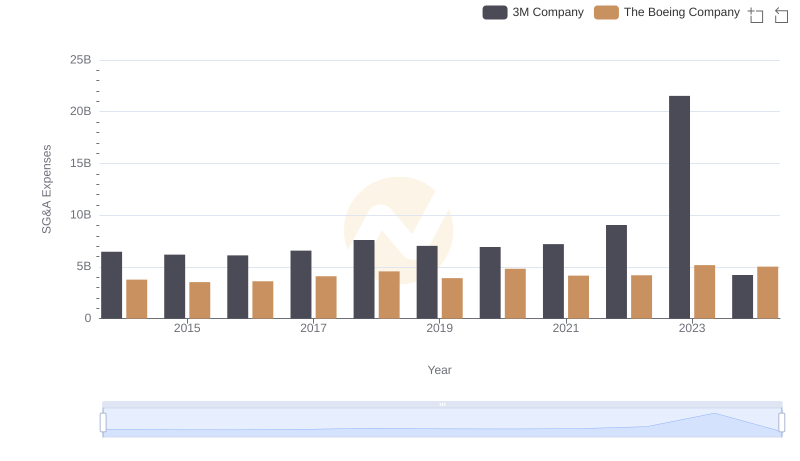
The Boeing Company or 3M Company: Who Manages SG&A Costs Better?
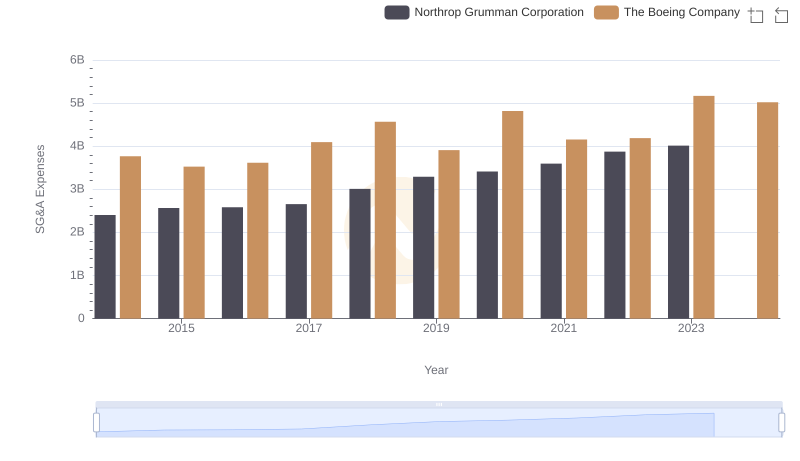
Operational Costs Compared: SG&A Analysis of The Boeing Company and Northrop Grumman Corporation