| __timestamp | Parker-Hannifin Corporation | The Boeing Company |
|---|---|---|
| Wednesday, January 1, 2014 | 1633992000 | 3767000000 |
| Thursday, January 1, 2015 | 1544746000 | 3525000000 |
| Friday, January 1, 2016 | 1359360000 | 3616000000 |
| Sunday, January 1, 2017 | 1453935000 | 4094000000 |
| Monday, January 1, 2018 | 1657152000 | 4567000000 |
| Tuesday, January 1, 2019 | 1543939000 | 3909000000 |
| Wednesday, January 1, 2020 | 1656553000 | 4817000000 |
| Friday, January 1, 2021 | 1527302000 | 4157000000 |
| Saturday, January 1, 2022 | 1627116000 | 4187000000 |
| Sunday, January 1, 2023 | 3354103000 | 5168000000 |
| Monday, January 1, 2024 | 3315177000 | 5021000000 |
Igniting the spark of knowledge
In the ever-evolving landscape of aerospace and industrial manufacturing, understanding the financial strategies of industry giants like The Boeing Company and Parker-Hannifin Corporation is crucial. Over the past decade, from 2014 to 2024, these two companies have demonstrated distinct approaches to managing their Selling, General, and Administrative (SG&A) expenses.
Boeing, a leader in aerospace, consistently allocated a higher percentage of its revenue to SG&A expenses, peaking in 2023 with a 37% increase from 2014. This reflects its commitment to innovation and market expansion. In contrast, Parker-Hannifin, a key player in motion and control technologies, showed a more conservative growth in SG&A spending, with a notable surge in 2023, doubling its 2014 expenditure. This strategic shift indicates a potential pivot towards aggressive market positioning.
These trends highlight the dynamic financial strategies employed by these corporations to navigate their respective industries.
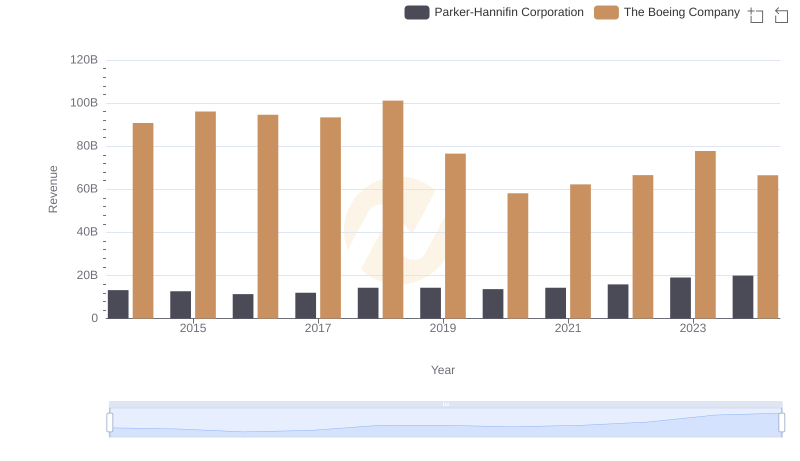
Revenue Showdown: The Boeing Company vs Parker-Hannifin Corporation
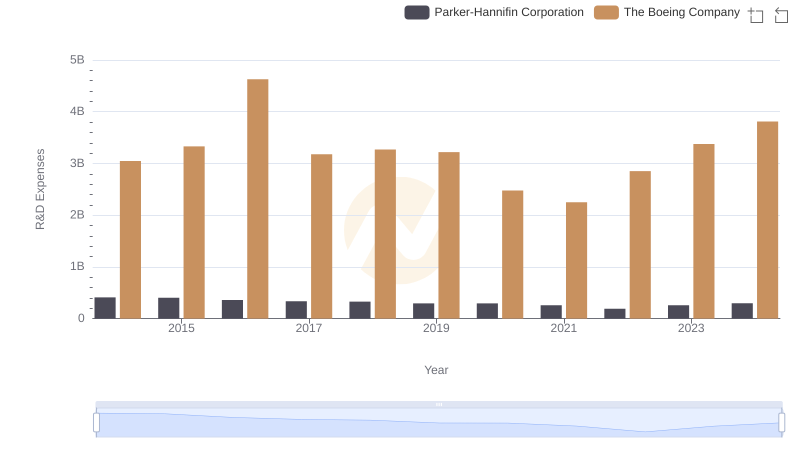
Research and Development Investment: The Boeing Company vs Parker-Hannifin Corporation
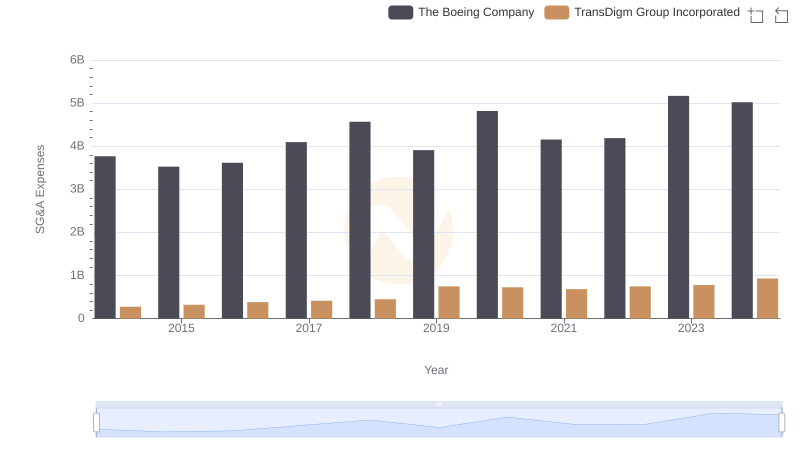
The Boeing Company and TransDigm Group Incorporated: SG&A Spending Patterns Compared
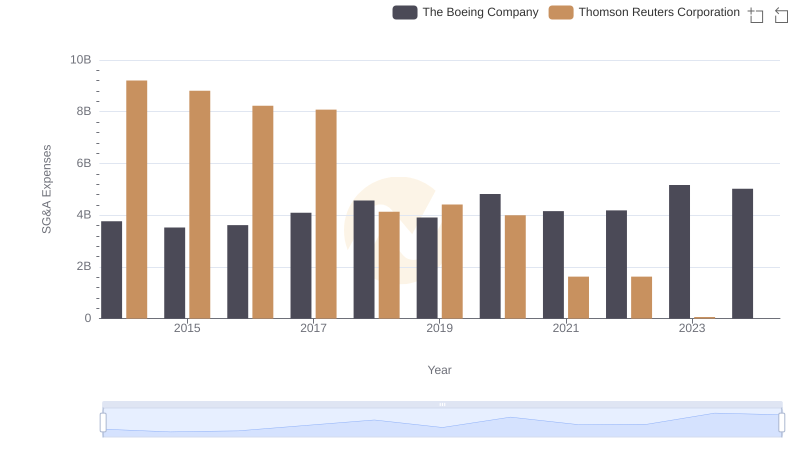
Selling, General, and Administrative Costs: The Boeing Company vs Thomson Reuters Corporation
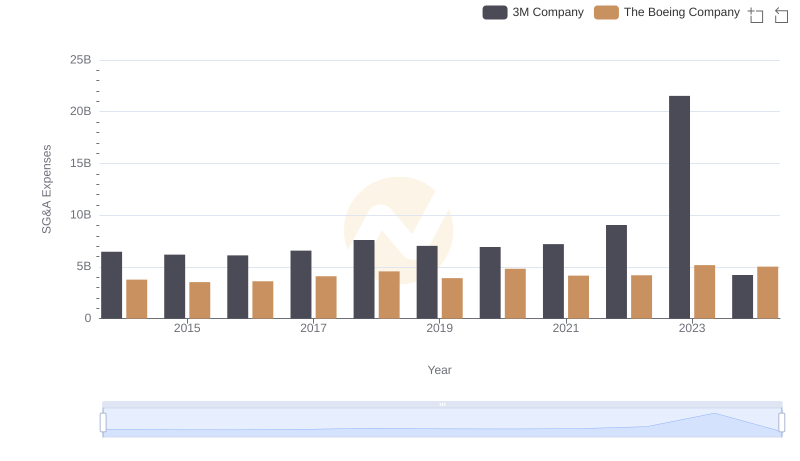
The Boeing Company or 3M Company: Who Manages SG&A Costs Better?