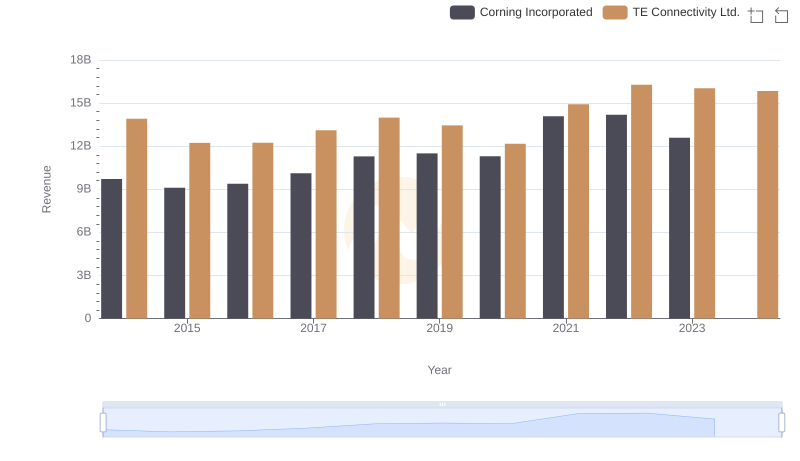
| __timestamp | Corning Incorporated | TE Connectivity Ltd. |
|---|---|---|
| Wednesday, January 1, 2014 | 5663000000 | 9220000000 |
| Thursday, January 1, 2015 | 5458000000 | 8146000000 |
| Friday, January 1, 2016 | 5644000000 | 8205000000 |
| Sunday, January 1, 2017 | 6084000000 | 8663000000 |
| Monday, January 1, 2018 | 6829000000 | 9243000000 |
| Tuesday, January 1, 2019 | 7468000000 | 9054000000 |
| Wednesday, January 1, 2020 | 7772000000 | 8437000000 |
| Friday, January 1, 2021 | 9019000000 | 10036000000 |
| Saturday, January 1, 2022 | 9683000000 | 11037000000 |
| Sunday, January 1, 2023 | 8657000000 | 10979000000 |
| Monday, January 1, 2024 | 8842000000 | 10389000000 |
Unleashing insights
In the ever-evolving landscape of technology and manufacturing, cost efficiency remains a pivotal factor for success. Over the past decade, TE Connectivity Ltd. and Corning Incorporated have showcased distinct trajectories in managing their cost of revenue. From 2014 to 2024, TE Connectivity consistently maintained a higher cost of revenue, peaking at approximately $10.4 billion in 2024, reflecting a 13% increase from 2014. Meanwhile, Corning Incorporated demonstrated a more volatile pattern, with a notable 71% surge from 2014 to 2022, reaching its zenith at $9.7 billion. This comparison highlights TE Connectivity's steady growth and Corning's dynamic adjustments in cost management. As these industry giants continue to innovate, their strategies in cost efficiency will undoubtedly influence their competitive edge in the global market.
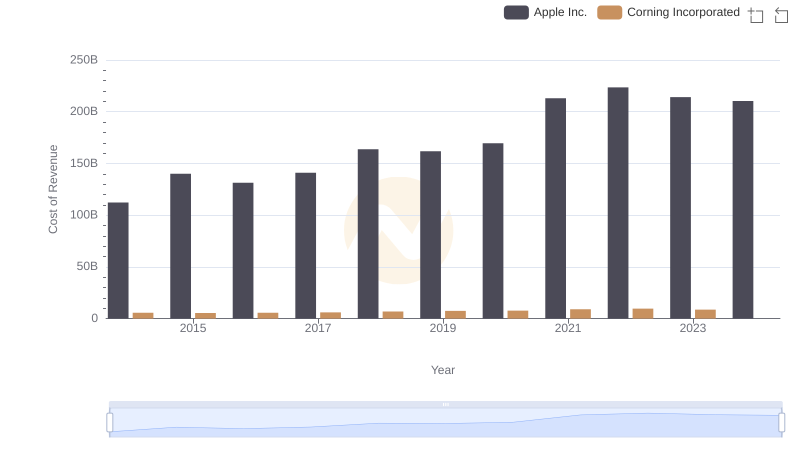
Cost Insights: Breaking Down Apple Inc. and Corning Incorporated's Expenses
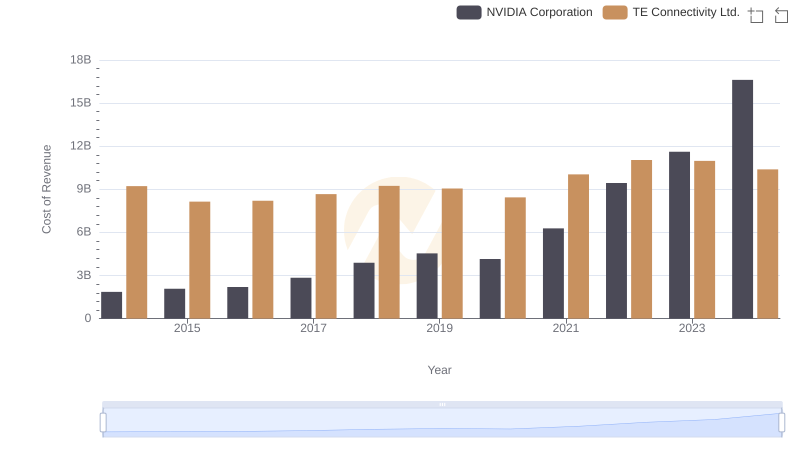
NVIDIA Corporation vs TE Connectivity Ltd.: Efficiency in Cost of Revenue Explored
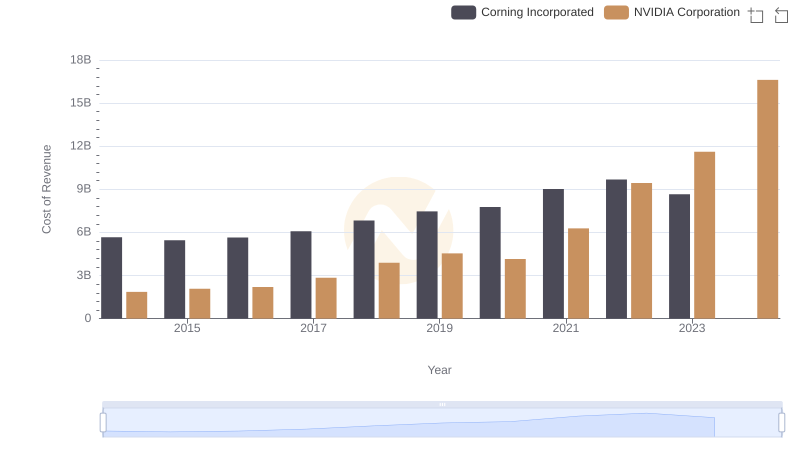
Cost of Revenue Comparison: NVIDIA Corporation vs Corning Incorporated
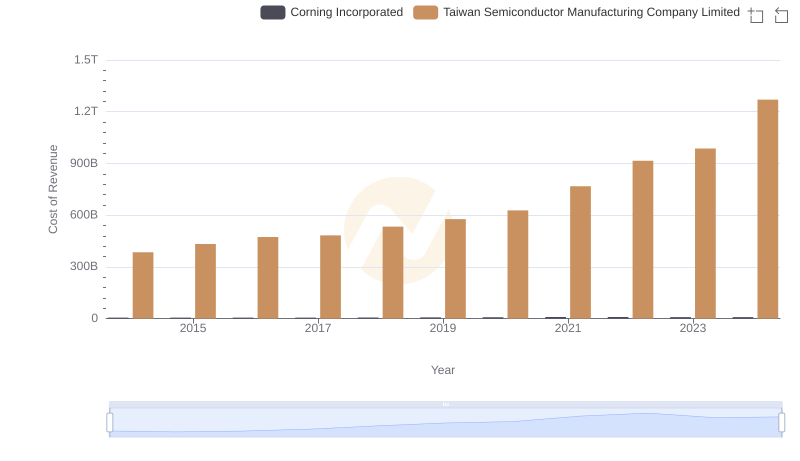
Cost of Revenue Trends: Taiwan Semiconductor Manufacturing Company Limited vs Corning Incorporated
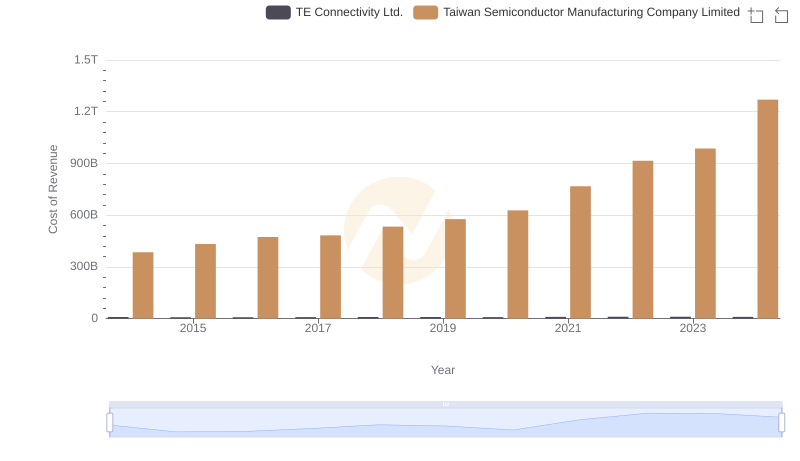
Cost of Revenue: Key Insights for Taiwan Semiconductor Manufacturing Company Limited and TE Connectivity Ltd.
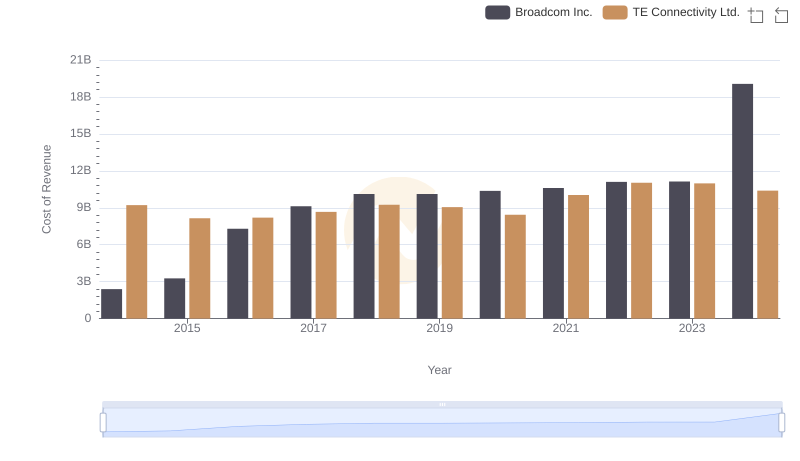
Broadcom Inc. vs TE Connectivity Ltd.: Efficiency in Cost of Revenue Explored
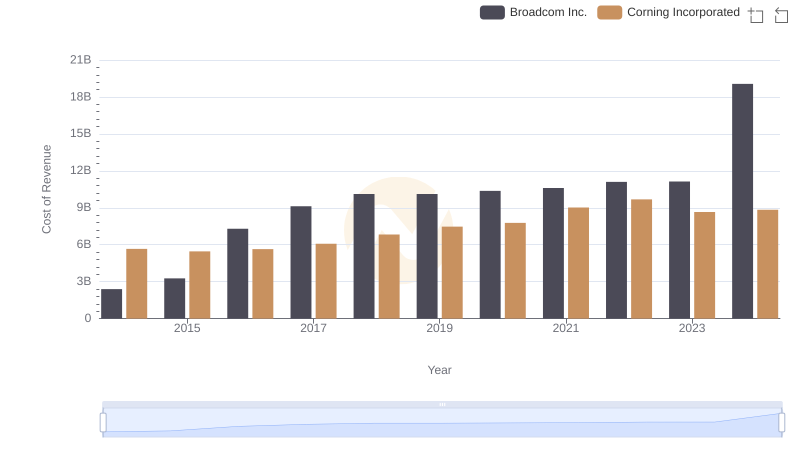
Cost Insights: Breaking Down Broadcom Inc. and Corning Incorporated's Expenses
Revenue Insights: TE Connectivity Ltd. and Corning Incorporated Performance Compared
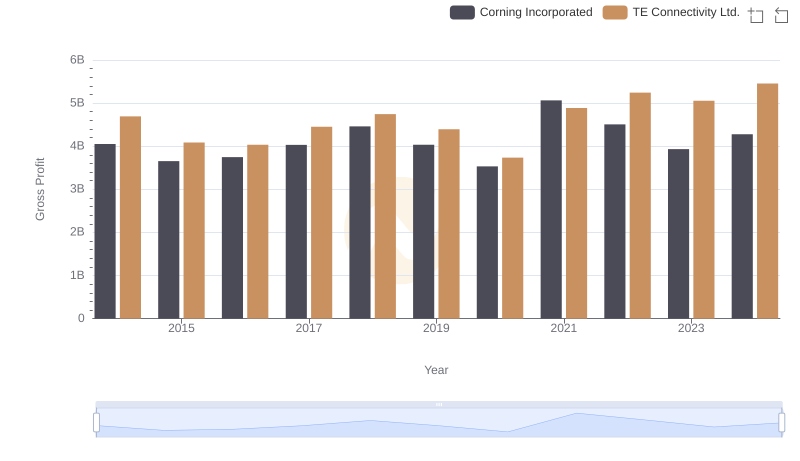
TE Connectivity Ltd. and Corning Incorporated: A Detailed Gross Profit Analysis
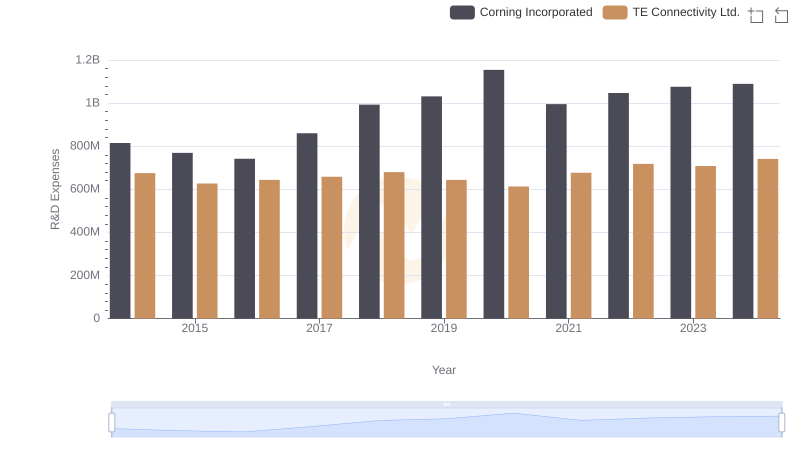
R&D Insights: How TE Connectivity Ltd. and Corning Incorporated Allocate Funds
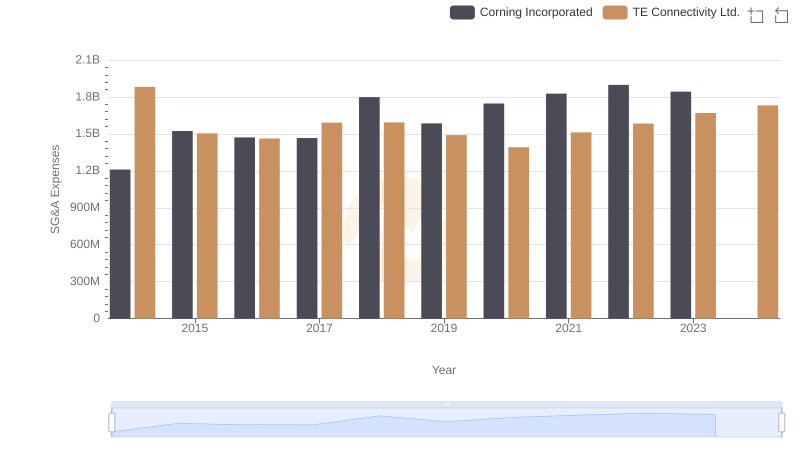
Cost Management Insights: SG&A Expenses for TE Connectivity Ltd. and Corning Incorporated
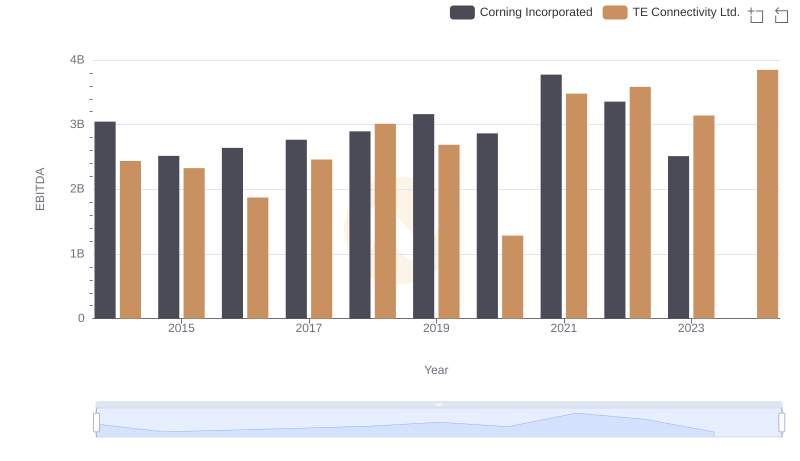
A Professional Review of EBITDA: TE Connectivity Ltd. Compared to Corning Incorporated