| __timestamp | Corning Incorporated | TE Connectivity Ltd. |
|---|---|---|
| Wednesday, January 1, 2014 | 9715000000 | 13912000000 |
| Thursday, January 1, 2015 | 9111000000 | 12233000000 |
| Friday, January 1, 2016 | 9390000000 | 12238000000 |
| Sunday, January 1, 2017 | 10116000000 | 13113000000 |
| Monday, January 1, 2018 | 11290000000 | 13988000000 |
| Tuesday, January 1, 2019 | 11503000000 | 13448000000 |
| Wednesday, January 1, 2020 | 11303000000 | 12172000000 |
| Friday, January 1, 2021 | 14082000000 | 14923000000 |
| Saturday, January 1, 2022 | 14189000000 | 16281000000 |
| Sunday, January 1, 2023 | 12588000000 | 16034000000 |
| Monday, January 1, 2024 | 13118000000 | 15845000000 |
Unveiling the hidden dimensions of data
In the competitive landscape of technology and connectivity, TE Connectivity Ltd. and Corning Incorporated have showcased remarkable revenue trajectories over the past decade. Since 2014, TE Connectivity has consistently outperformed Corning, with revenues peaking in 2022 at approximately 16.3 billion, marking a 17% increase from 2014. Corning, while trailing, demonstrated a steady growth pattern, achieving its highest revenue in 2022 at around 14.2 billion, a 46% rise from its 2015 low.
The data reveals a compelling narrative of resilience and adaptation. TE Connectivity's revenue dipped slightly in 2020, likely due to global disruptions, but rebounded strongly in subsequent years. Corning, on the other hand, showed a more gradual recovery, reflecting its strategic investments in innovation and market expansion. As we look to 2024, both companies continue to navigate the evolving market dynamics, with TE Connectivity maintaining a lead in revenue generation.
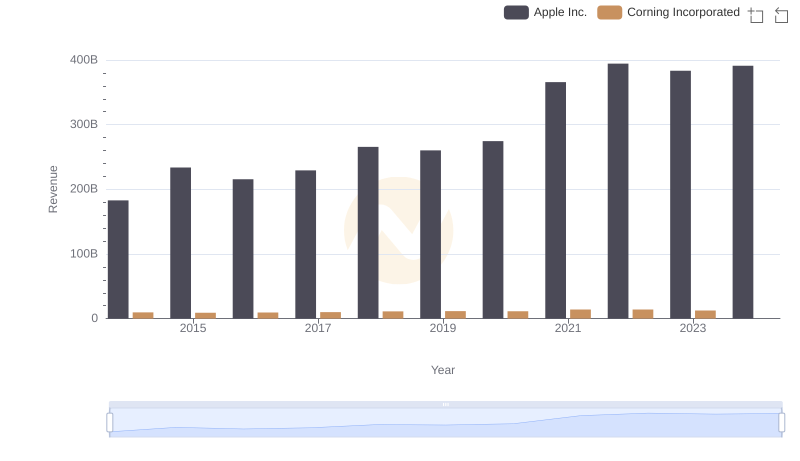
Annual Revenue Comparison: Apple Inc. vs Corning Incorporated
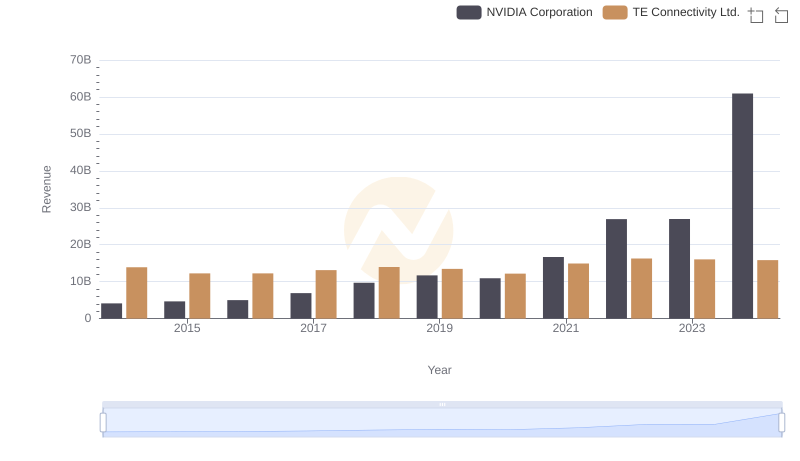
Breaking Down Revenue Trends: NVIDIA Corporation vs TE Connectivity Ltd.
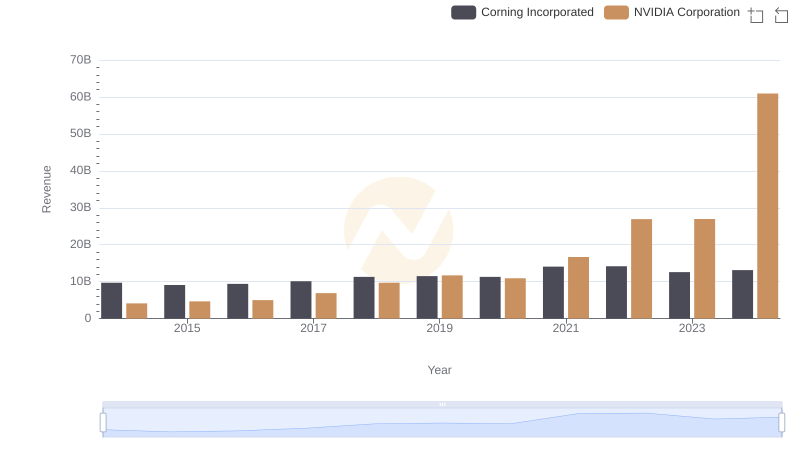
Revenue Showdown: NVIDIA Corporation vs Corning Incorporated
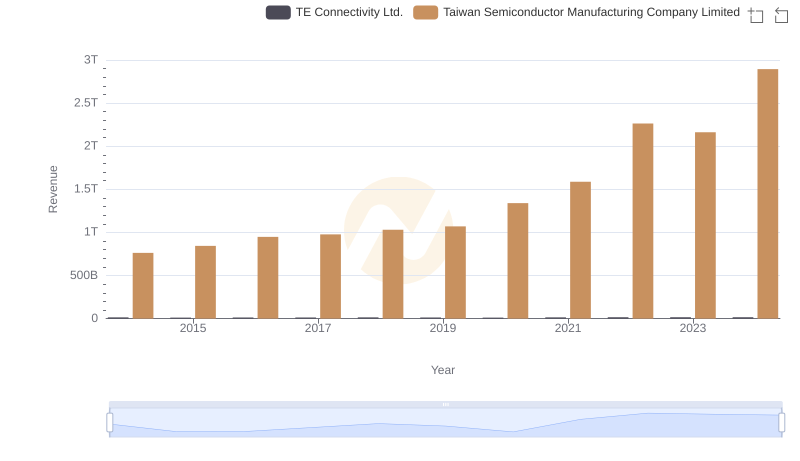
Taiwan Semiconductor Manufacturing Company Limited vs TE Connectivity Ltd.: Annual Revenue Growth Compared

Breaking Down Revenue Trends: Taiwan Semiconductor Manufacturing Company Limited vs Corning Incorporated
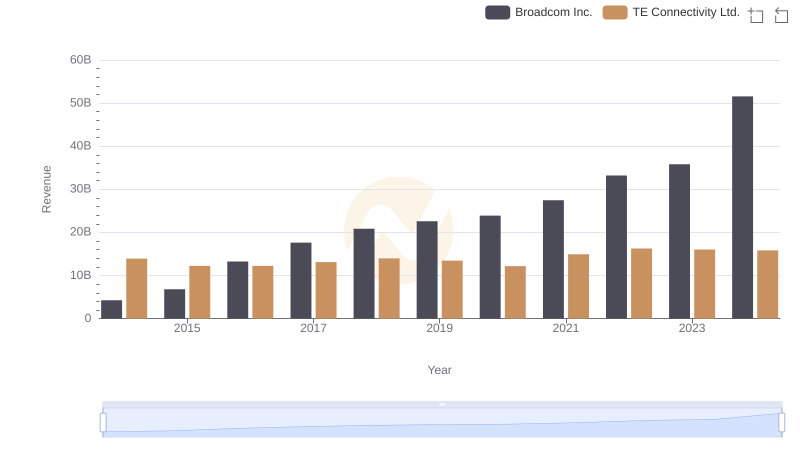
Annual Revenue Comparison: Broadcom Inc. vs TE Connectivity Ltd.
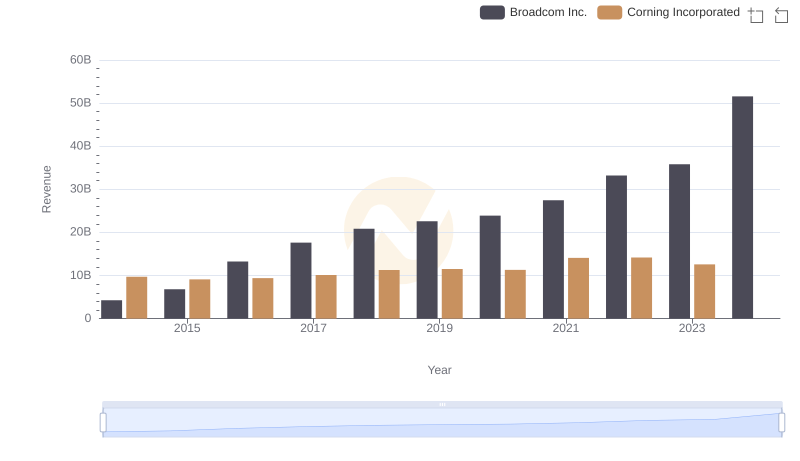
Annual Revenue Comparison: Broadcom Inc. vs Corning Incorporated
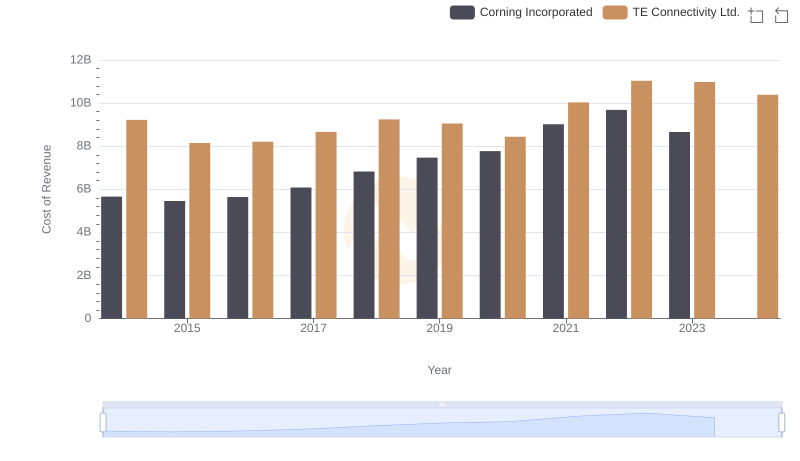
TE Connectivity Ltd. vs Corning Incorporated: Efficiency in Cost of Revenue Explored
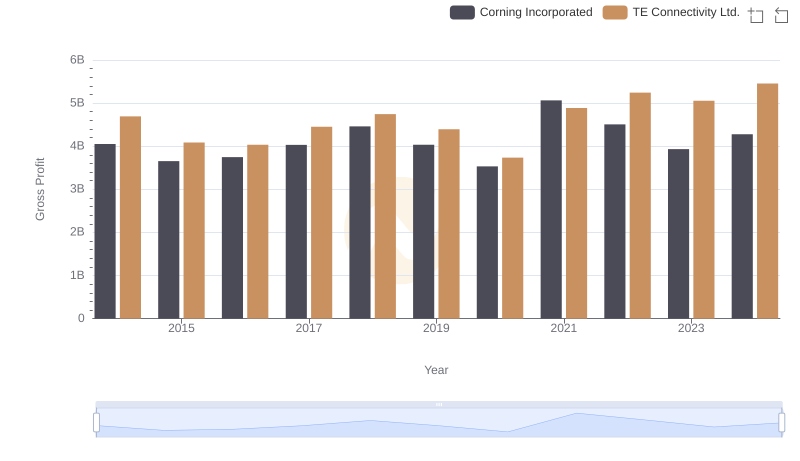
TE Connectivity Ltd. and Corning Incorporated: A Detailed Gross Profit Analysis
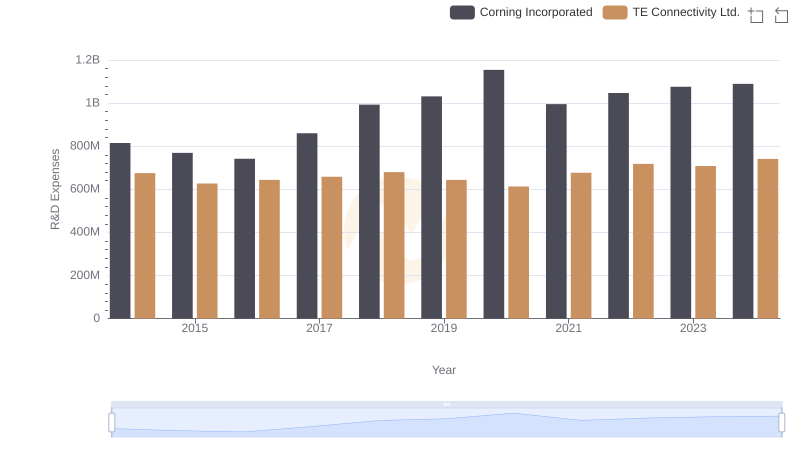
R&D Insights: How TE Connectivity Ltd. and Corning Incorporated Allocate Funds
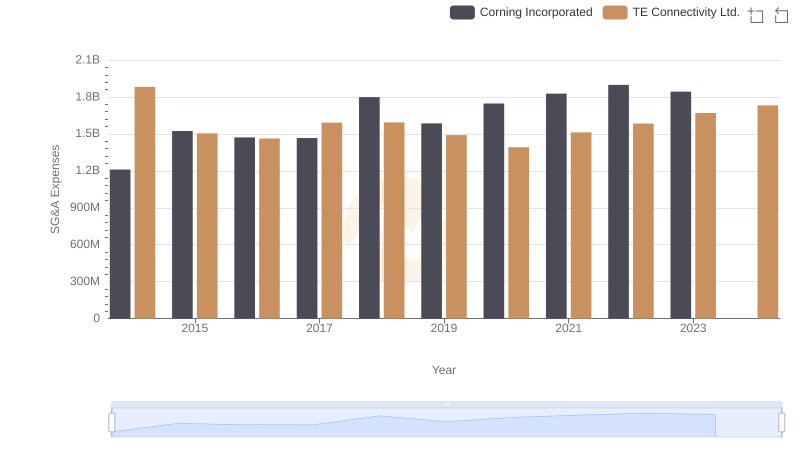
Cost Management Insights: SG&A Expenses for TE Connectivity Ltd. and Corning Incorporated
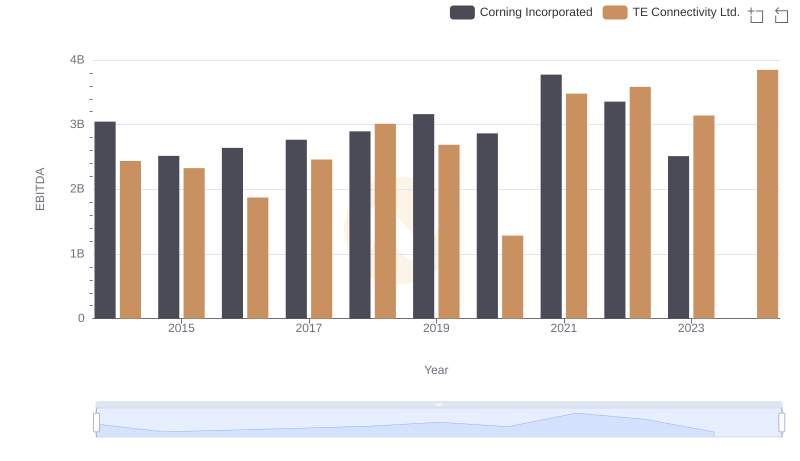
A Professional Review of EBITDA: TE Connectivity Ltd. Compared to Corning Incorporated