| __timestamp | Corning Incorporated | TE Connectivity Ltd. |
|---|---|---|
| Wednesday, January 1, 2014 | 4052000000 | 4692000000 |
| Thursday, January 1, 2015 | 3653000000 | 4087000000 |
| Friday, January 1, 2016 | 3746000000 | 4033000000 |
| Sunday, January 1, 2017 | 4032000000 | 4450000000 |
| Monday, January 1, 2018 | 4461000000 | 4745000000 |
| Tuesday, January 1, 2019 | 4035000000 | 4394000000 |
| Wednesday, January 1, 2020 | 3531000000 | 3735000000 |
| Friday, January 1, 2021 | 5063000000 | 4887000000 |
| Saturday, January 1, 2022 | 4506000000 | 5244000000 |
| Sunday, January 1, 2023 | 3931000000 | 5055000000 |
| Monday, January 1, 2024 | 4276000000 | 5456000000 |
Igniting the spark of knowledge
In the ever-evolving landscape of technology and innovation, understanding the financial health of industry giants is crucial. This analysis delves into the gross profit trends of TE Connectivity Ltd. and Corning Incorporated from 2014 to 2024. Over this decade, TE Connectivity consistently outperformed Corning, with an average gross profit approximately 12% higher. Notably, in 2022, TE Connectivity's gross profit surged to 5.24 billion, marking a 40% increase from its 2020 low. Meanwhile, Corning's gross profit peaked in 2021 at 5.06 billion, reflecting a robust recovery post-2020. The data reveals a compelling narrative of resilience and growth, with TE Connectivity demonstrating a steady upward trajectory, particularly in recent years. As we look to the future, these trends offer valuable insights into the strategic positioning and market adaptability of these two industry leaders.
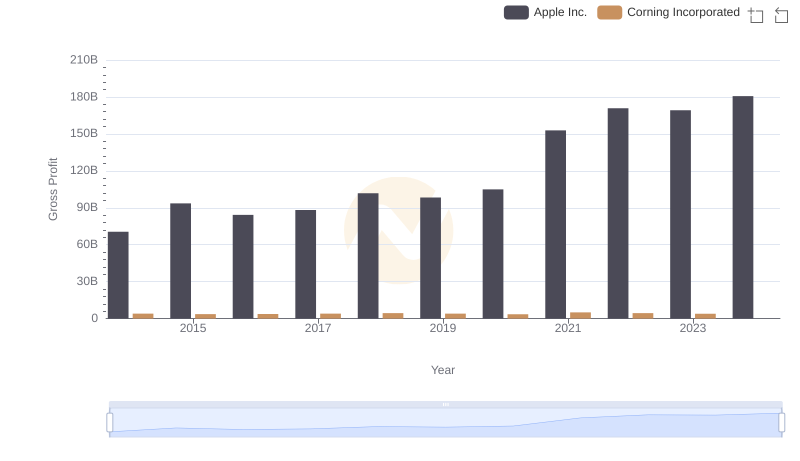
Key Insights on Gross Profit: Apple Inc. vs Corning Incorporated
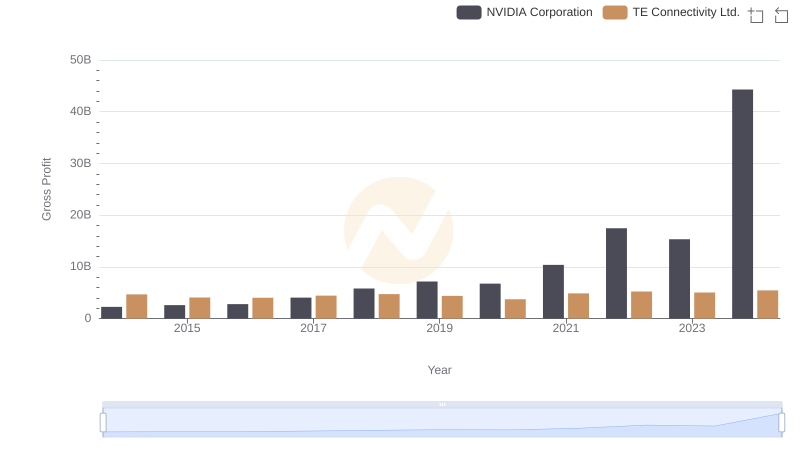
Gross Profit Trends Compared: NVIDIA Corporation vs TE Connectivity Ltd.
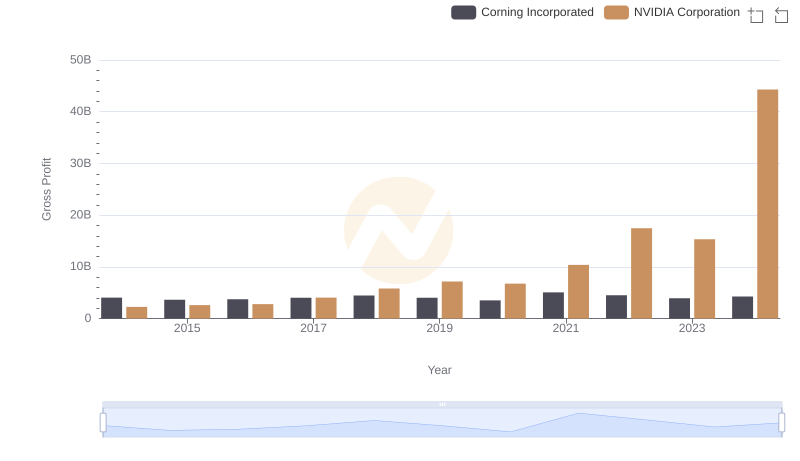
Who Generates Higher Gross Profit? NVIDIA Corporation or Corning Incorporated

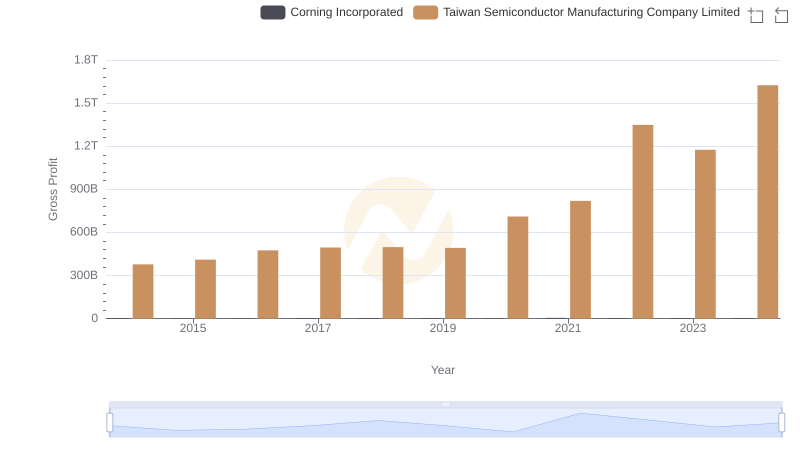
Gross Profit Comparison: Taiwan Semiconductor Manufacturing Company Limited and TE Connectivity Ltd. Trends
Taiwan Semiconductor Manufacturing Company Limited vs Corning Incorporated: A Gross Profit Performance Breakdown
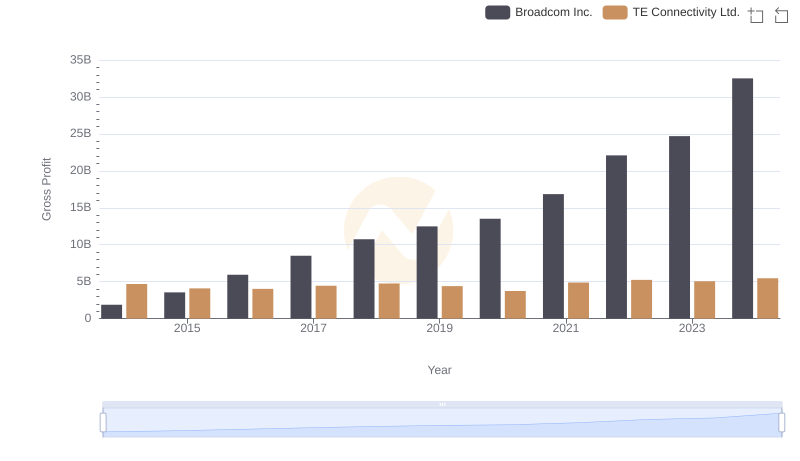
Broadcom Inc. vs TE Connectivity Ltd.: A Gross Profit Performance Breakdown
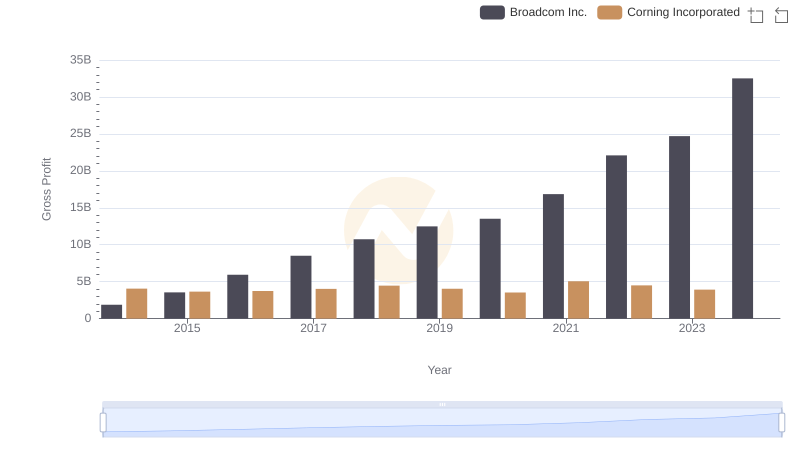
Gross Profit Analysis: Comparing Broadcom Inc. and Corning Incorporated
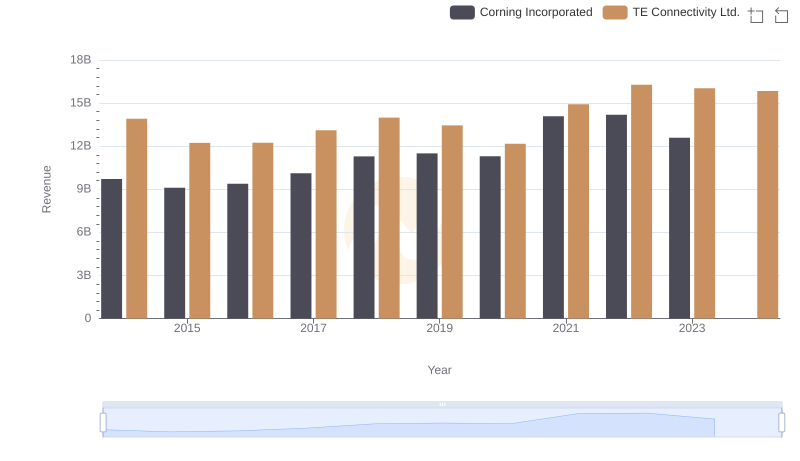
Revenue Insights: TE Connectivity Ltd. and Corning Incorporated Performance Compared
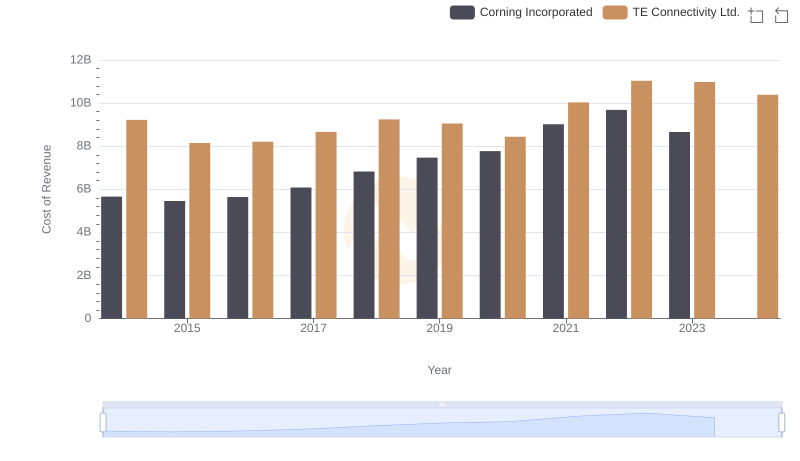
TE Connectivity Ltd. vs Corning Incorporated: Efficiency in Cost of Revenue Explored
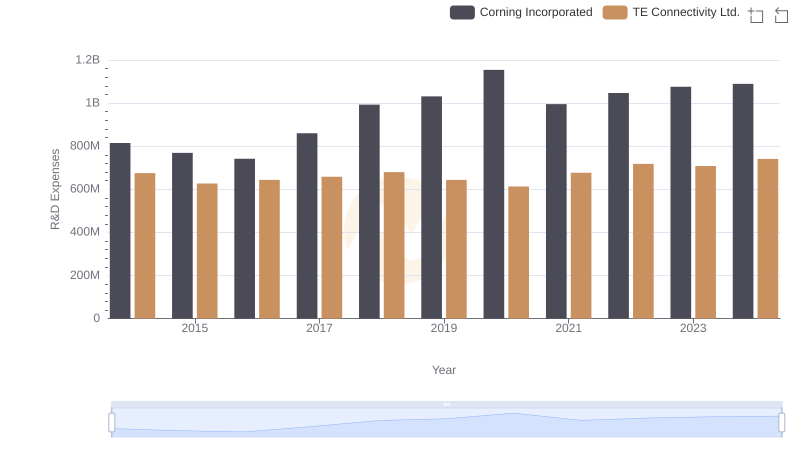
R&D Insights: How TE Connectivity Ltd. and Corning Incorporated Allocate Funds
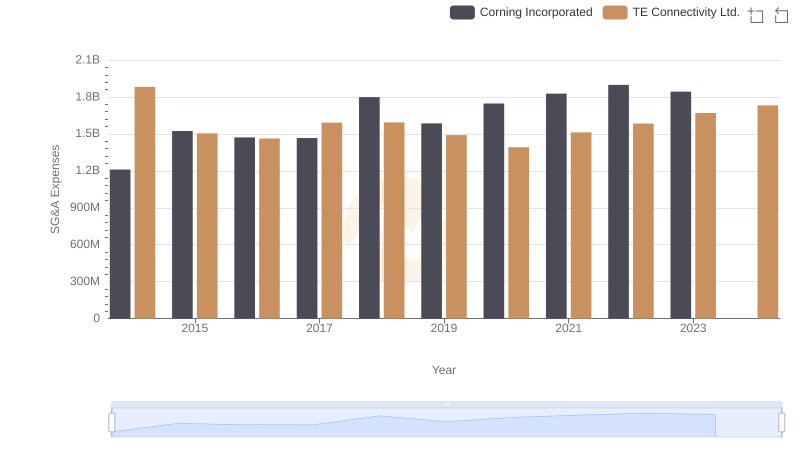
Cost Management Insights: SG&A Expenses for TE Connectivity Ltd. and Corning Incorporated
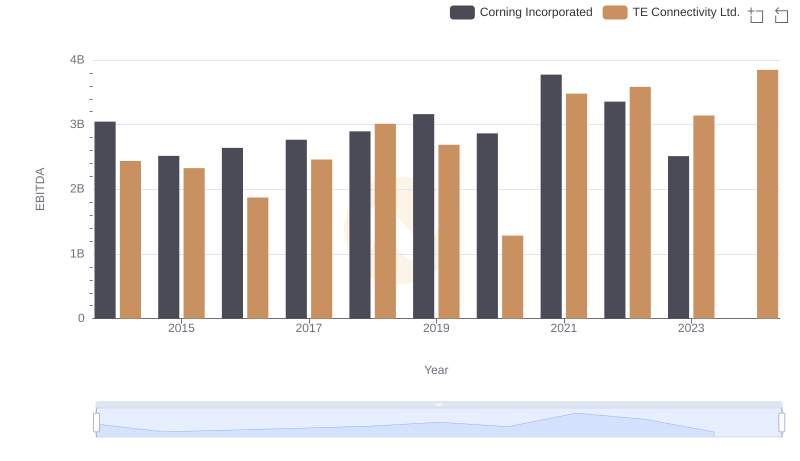
A Professional Review of EBITDA: TE Connectivity Ltd. Compared to Corning Incorporated