| __timestamp | Corning Incorporated | TE Connectivity Ltd. |
|---|---|---|
| Wednesday, January 1, 2014 | 815000000 | 675000000 |
| Thursday, January 1, 2015 | 769000000 | 627000000 |
| Friday, January 1, 2016 | 742000000 | 644000000 |
| Sunday, January 1, 2017 | 860000000 | 658000000 |
| Monday, January 1, 2018 | 993000000 | 680000000 |
| Tuesday, January 1, 2019 | 1031000000 | 644000000 |
| Wednesday, January 1, 2020 | 1154000000 | 613000000 |
| Friday, January 1, 2021 | 995000000 | 677000000 |
| Saturday, January 1, 2022 | 1047000000 | 718000000 |
| Sunday, January 1, 2023 | 1076000000 | 708000000 |
| Monday, January 1, 2024 | 1089000000 | 741000000 |
In pursuit of knowledge
In the ever-evolving landscape of technology and innovation, research and development (R&D) spending is a critical indicator of a company's commitment to future growth. Over the past decade, Corning Incorporated and TE Connectivity Ltd. have demonstrated distinct strategies in their R&D allocations.
From 2014 to 2024, Corning's R&D expenses have surged by approximately 34%, peaking in 2020 with a notable 1.15 billion USD. This reflects Corning's robust investment in innovation, particularly in glass and ceramics technologies. In contrast, TE Connectivity's R&D spending has shown a steadier growth, increasing by about 10% over the same period, with a significant uptick in 2024. This suggests a strategic focus on connectivity and sensor solutions.
These trends highlight the differing priorities and market strategies of these industry giants, offering valuable insights into their future trajectories.
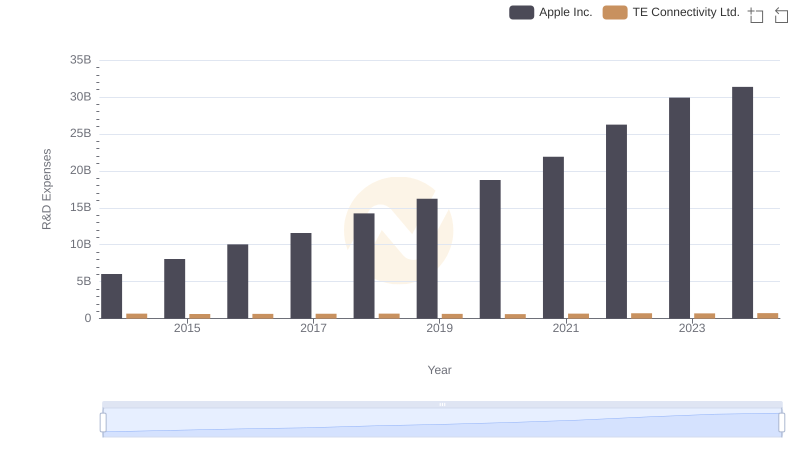
Who Prioritizes Innovation? R&D Spending Compared for Apple Inc. and TE Connectivity Ltd.
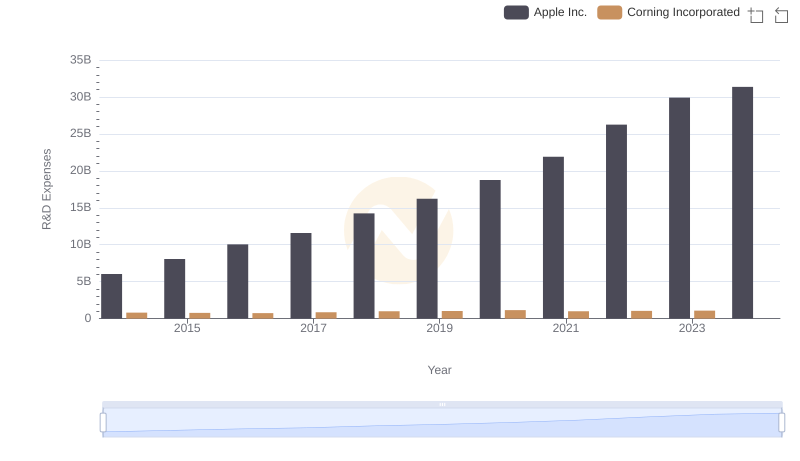
R&D Insights: How Apple Inc. and Corning Incorporated Allocate Funds
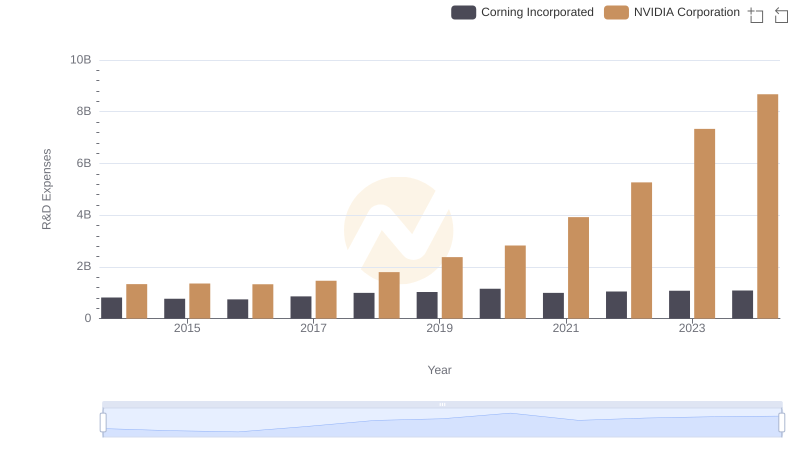
Who Prioritizes Innovation? R&D Spending Compared for NVIDIA Corporation and Corning Incorporated
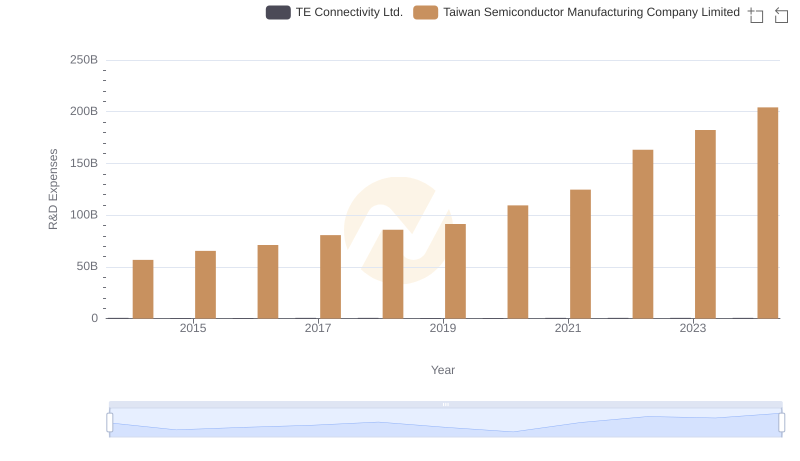
Comparing Innovation Spending: Taiwan Semiconductor Manufacturing Company Limited and TE Connectivity Ltd.

Taiwan Semiconductor Manufacturing Company Limited vs Corning Incorporated: Strategic Focus on R&D Spending
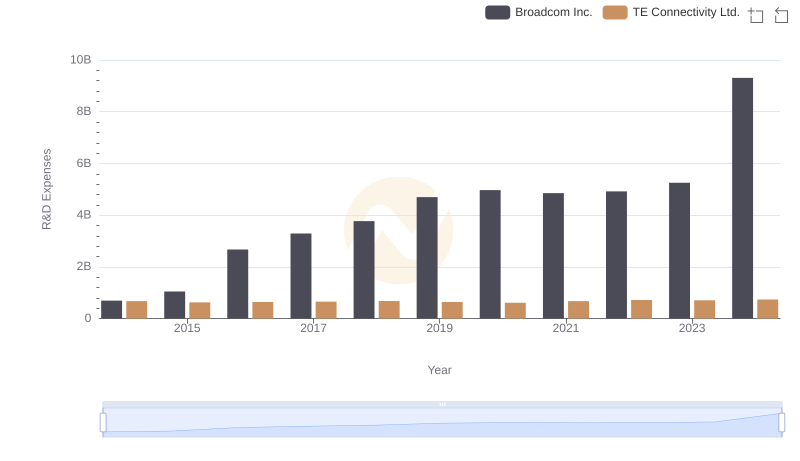
Broadcom Inc. or TE Connectivity Ltd.: Who Invests More in Innovation?
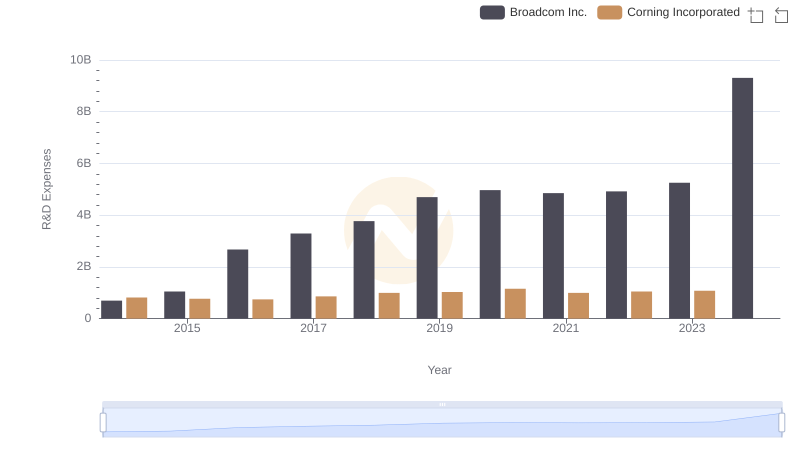
Analyzing R&D Budgets: Broadcom Inc. vs Corning Incorporated
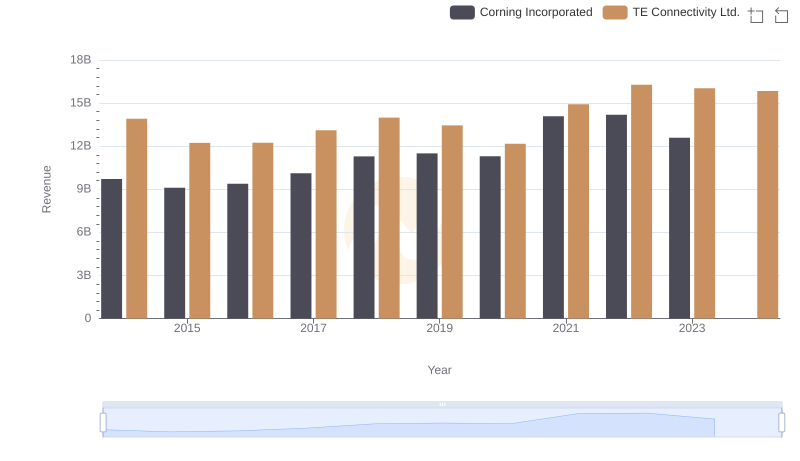
Revenue Insights: TE Connectivity Ltd. and Corning Incorporated Performance Compared
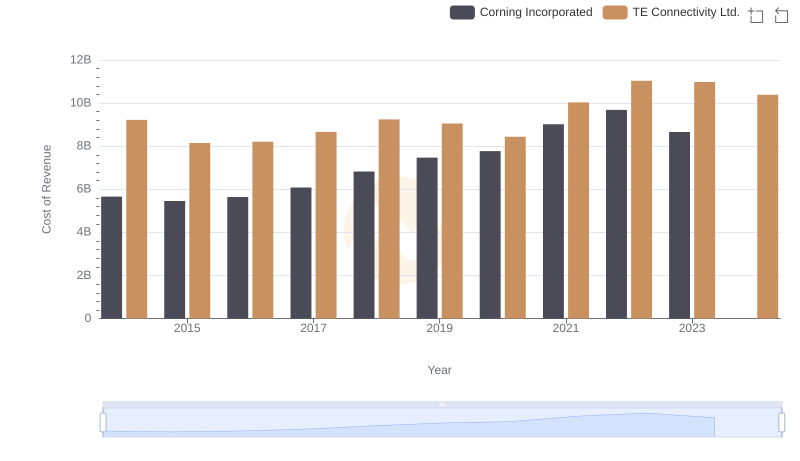
TE Connectivity Ltd. vs Corning Incorporated: Efficiency in Cost of Revenue Explored
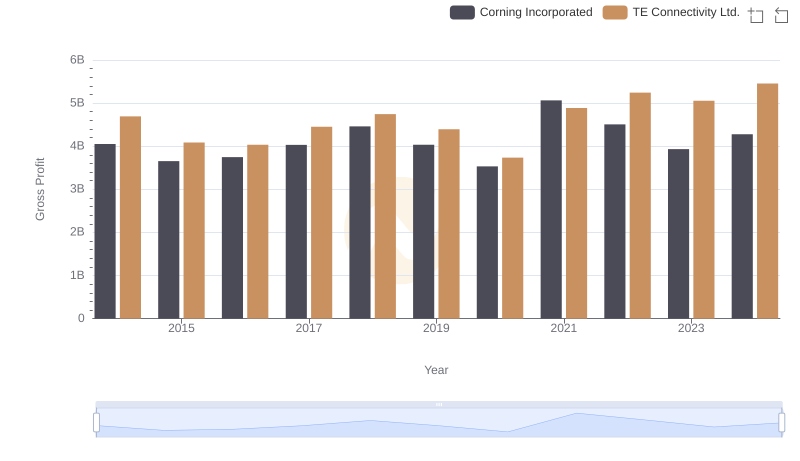
TE Connectivity Ltd. and Corning Incorporated: A Detailed Gross Profit Analysis
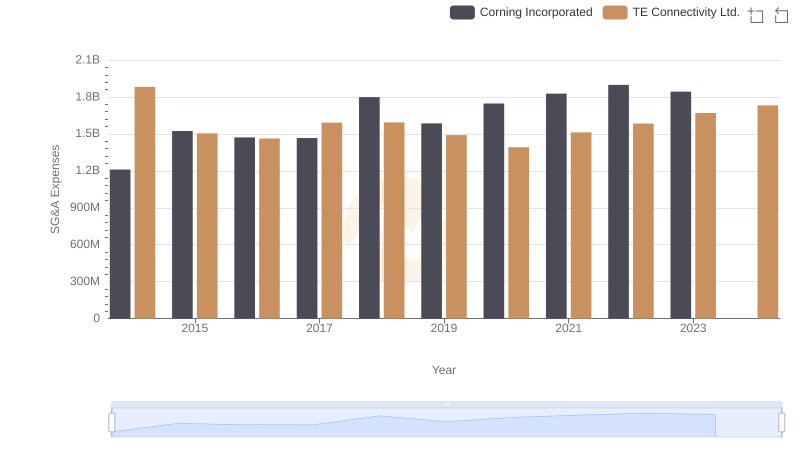
Cost Management Insights: SG&A Expenses for TE Connectivity Ltd. and Corning Incorporated
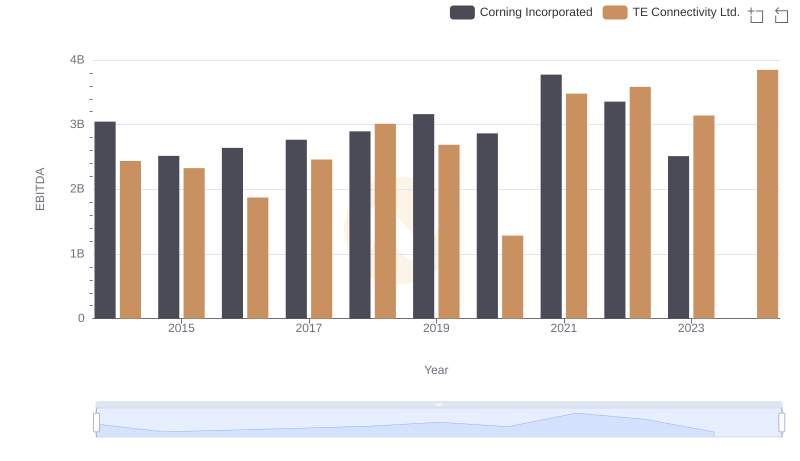
A Professional Review of EBITDA: TE Connectivity Ltd. Compared to Corning Incorporated