| __timestamp | Corning Incorporated | TE Connectivity Ltd. |
|---|---|---|
| Wednesday, January 1, 2014 | 1211000000 | 1882000000 |
| Thursday, January 1, 2015 | 1523000000 | 1504000000 |
| Friday, January 1, 2016 | 1472000000 | 1463000000 |
| Sunday, January 1, 2017 | 1467000000 | 1591000000 |
| Monday, January 1, 2018 | 1799000000 | 1594000000 |
| Tuesday, January 1, 2019 | 1585000000 | 1490000000 |
| Wednesday, January 1, 2020 | 1747000000 | 1392000000 |
| Friday, January 1, 2021 | 1827000000 | 1512000000 |
| Saturday, January 1, 2022 | 1898000000 | 1584000000 |
| Sunday, January 1, 2023 | 1843000000 | 1670000000 |
| Monday, January 1, 2024 | 1931000000 | 1732000000 |
In pursuit of knowledge
In the ever-evolving landscape of corporate finance, managing Selling, General, and Administrative (SG&A) expenses is crucial for maintaining profitability. Over the past decade, TE Connectivity Ltd. and Corning Incorporated have demonstrated distinct approaches to cost management.
From 2014 to 2023, Corning Incorporated's SG&A expenses have shown a steady increase, peaking in 2022 with a 57% rise from 2014. This upward trend reflects Corning's strategic investments in innovation and market expansion. In contrast, TE Connectivity Ltd. has maintained a more stable SG&A expense profile, with a slight dip in 2020, likely due to global economic challenges. By 2023, TE Connectivity's expenses rebounded, marking a 12% increase from 2014.
Interestingly, 2024 data for Corning is missing, suggesting potential shifts in financial strategies. These insights underscore the importance of adaptive cost management in sustaining competitive advantage.
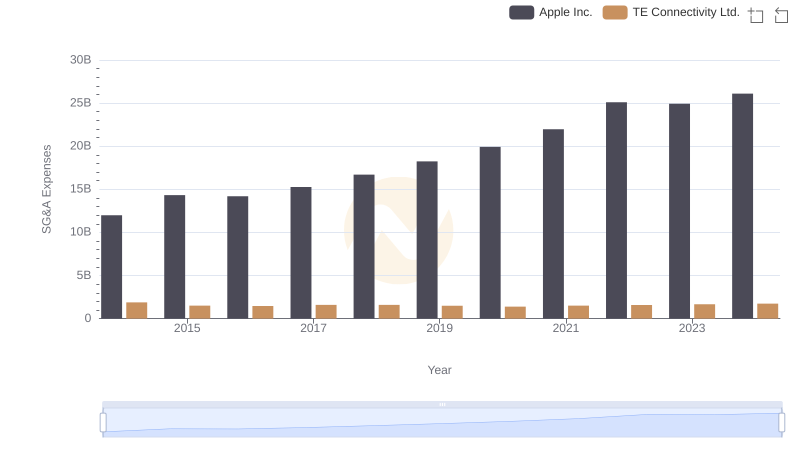
Apple Inc. or TE Connectivity Ltd.: Who Manages SG&A Costs Better?
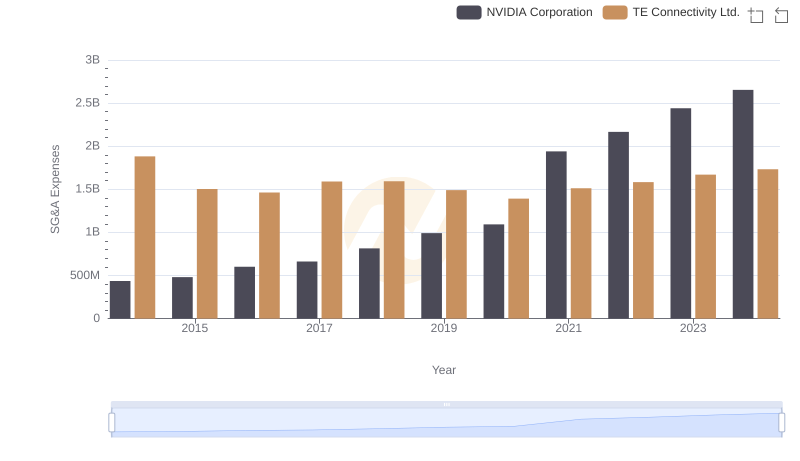
Comparing SG&A Expenses: NVIDIA Corporation vs TE Connectivity Ltd. Trends and Insights
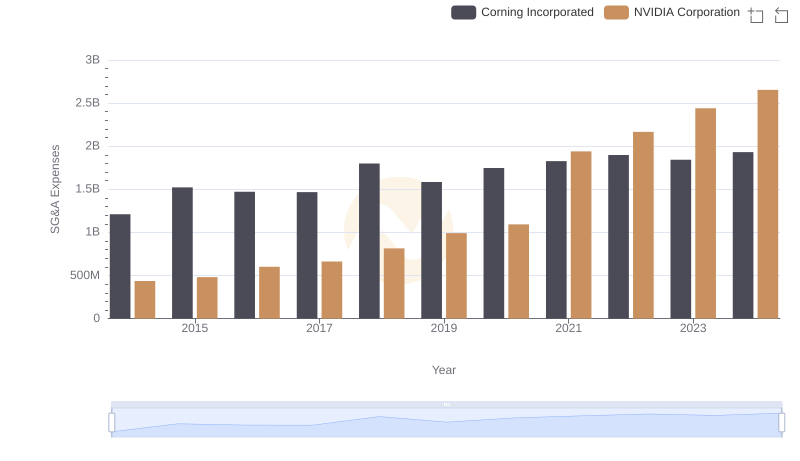
NVIDIA Corporation or Corning Incorporated: Who Manages SG&A Costs Better?

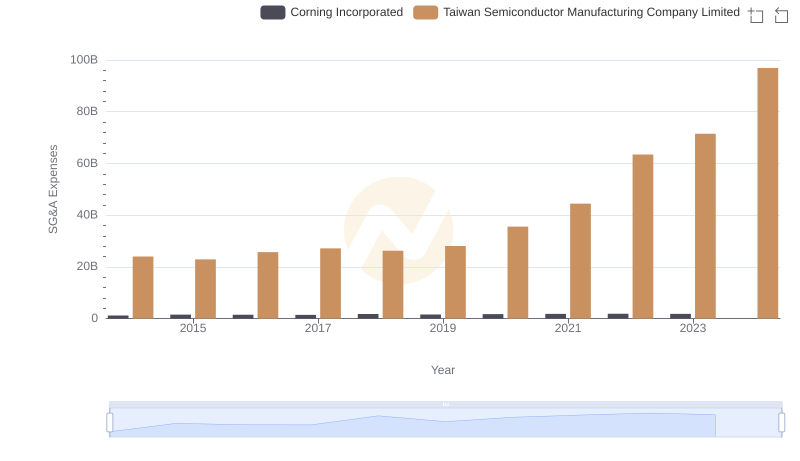
Taiwan Semiconductor Manufacturing Company Limited vs TE Connectivity Ltd.: SG&A Expense Trends
Operational Costs Compared: SG&A Analysis of Taiwan Semiconductor Manufacturing Company Limited and Corning Incorporated
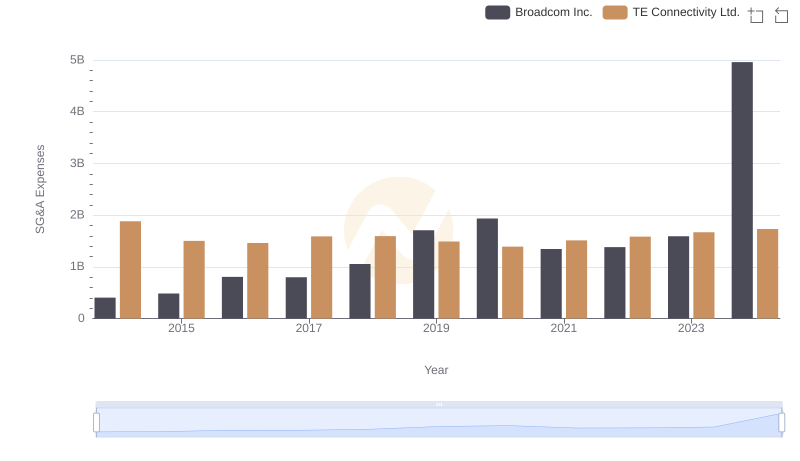
Breaking Down SG&A Expenses: Broadcom Inc. vs TE Connectivity Ltd.
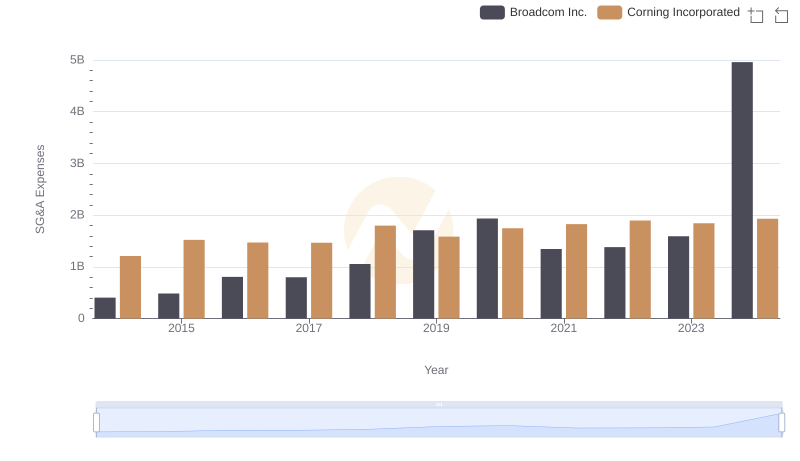
Breaking Down SG&A Expenses: Broadcom Inc. vs Corning Incorporated
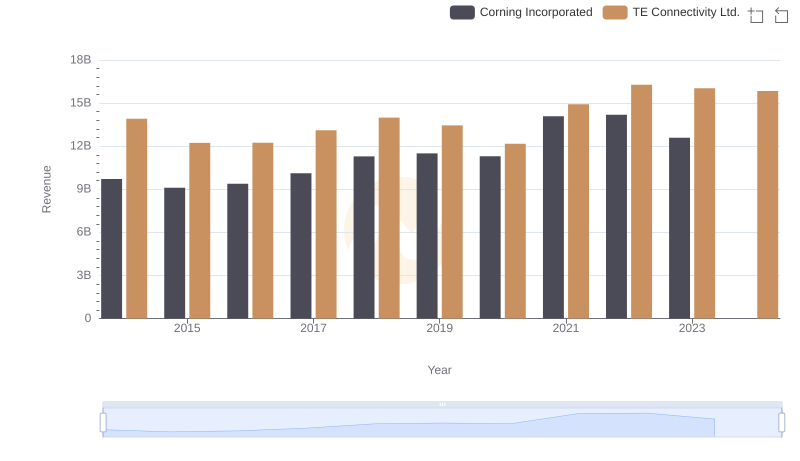
Revenue Insights: TE Connectivity Ltd. and Corning Incorporated Performance Compared
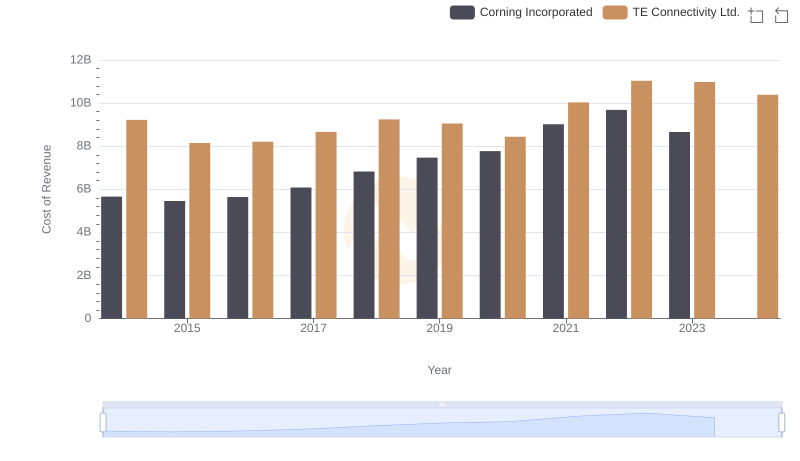
TE Connectivity Ltd. vs Corning Incorporated: Efficiency in Cost of Revenue Explored
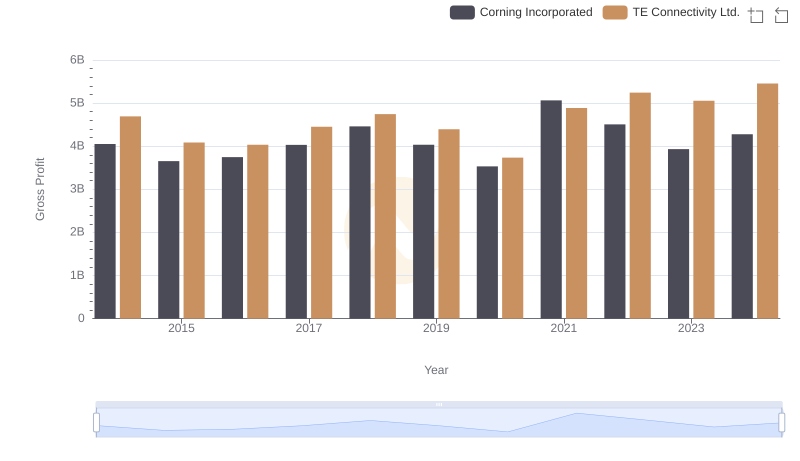
TE Connectivity Ltd. and Corning Incorporated: A Detailed Gross Profit Analysis
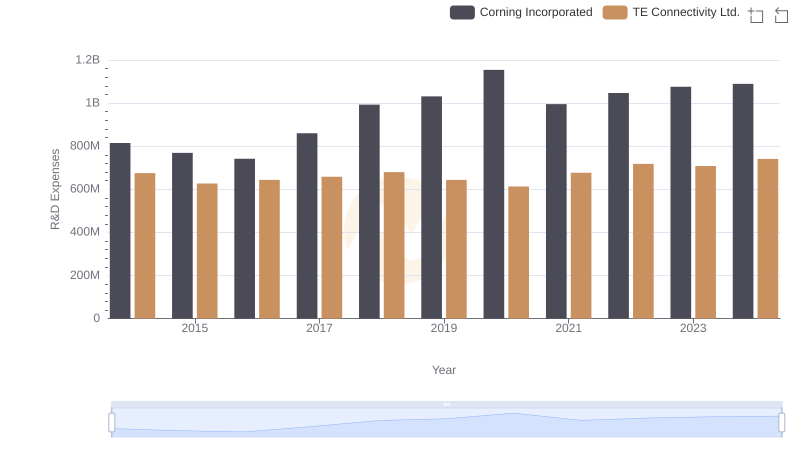
R&D Insights: How TE Connectivity Ltd. and Corning Incorporated Allocate Funds
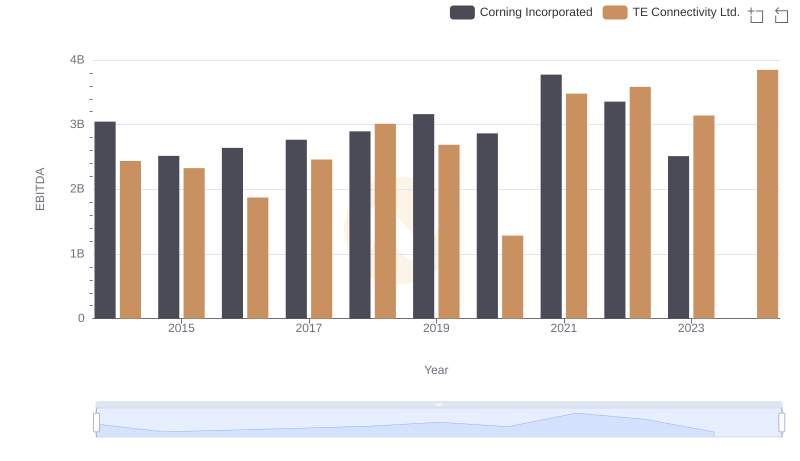
A Professional Review of EBITDA: TE Connectivity Ltd. Compared to Corning Incorporated