| __timestamp | Corning Incorporated | TE Connectivity Ltd. |
|---|---|---|
| Wednesday, January 1, 2014 | 3046000000 | 2438000000 |
| Thursday, January 1, 2015 | 2517000000 | 2327000000 |
| Friday, January 1, 2016 | 2640000000 | 1874000000 |
| Sunday, January 1, 2017 | 2766000000 | 2461000000 |
| Monday, January 1, 2018 | 2897000000 | 3014000000 |
| Tuesday, January 1, 2019 | 3163000000 | 2689000000 |
| Wednesday, January 1, 2020 | 2865000000 | 1283000000 |
| Friday, January 1, 2021 | 3774000000 | 3479000000 |
| Saturday, January 1, 2022 | 3357000000 | 3584000000 |
| Sunday, January 1, 2023 | 2514000000 | 3142000000 |
| Monday, January 1, 2024 | 2492000000 | 3848000000 |
Unveiling the hidden dimensions of data
In the ever-evolving landscape of technology and connectivity, understanding financial health is crucial. This analysis delves into the EBITDA trends of TE Connectivity Ltd. and Corning Incorporated from 2014 to 2024. Over this decade, TE Connectivity has shown a remarkable growth trajectory, with its EBITDA increasing by approximately 58% from 2014 to 2024. In contrast, Corning Incorporated experienced a decline of about 63% in the same period.
The year 2021 marked a significant turning point for both companies, with TE Connectivity surpassing Corning in EBITDA for the first time. By 2024, TE Connectivity's EBITDA reached its peak, while Corning's figures dwindled. This shift highlights TE Connectivity's strategic advancements in the connectivity sector, positioning it as a formidable player. As the industry continues to innovate, these financial insights provide a glimpse into the competitive dynamics shaping the future.
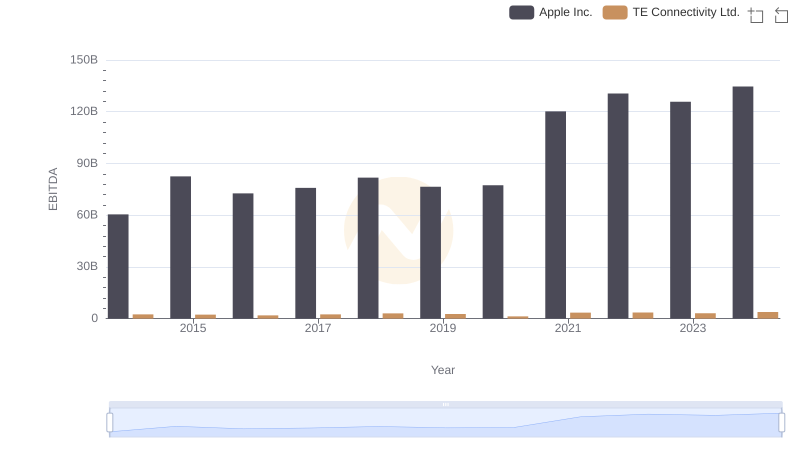
EBITDA Metrics Evaluated: Apple Inc. vs TE Connectivity Ltd.
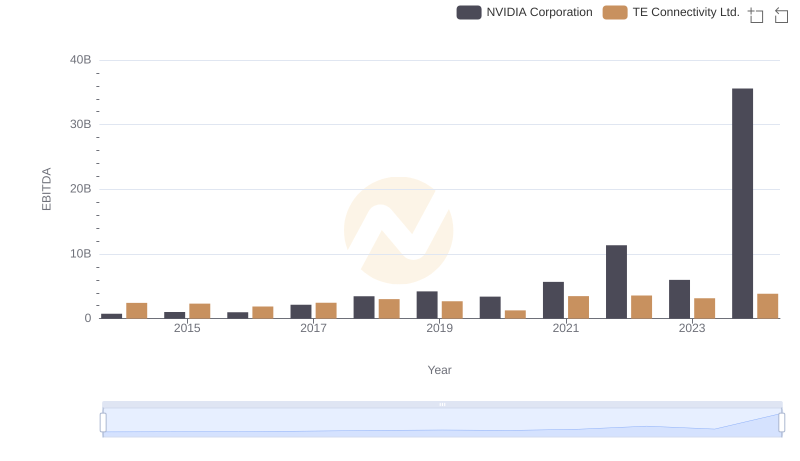
NVIDIA Corporation and TE Connectivity Ltd.: A Detailed Examination of EBITDA Performance
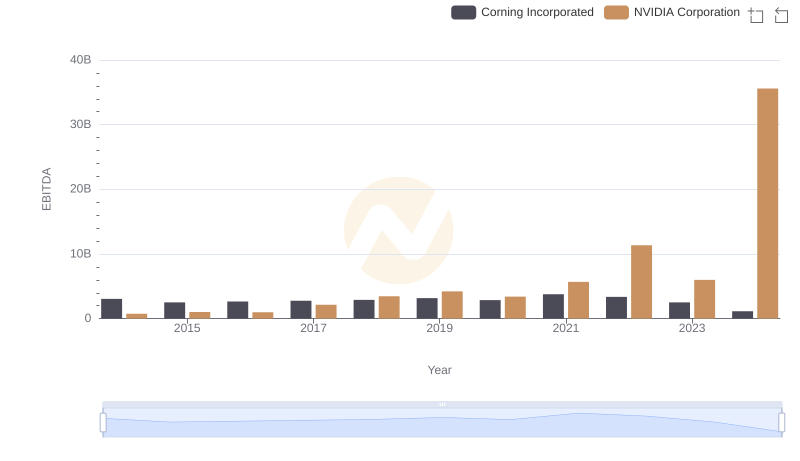
NVIDIA Corporation vs Corning Incorporated: In-Depth EBITDA Performance Comparison
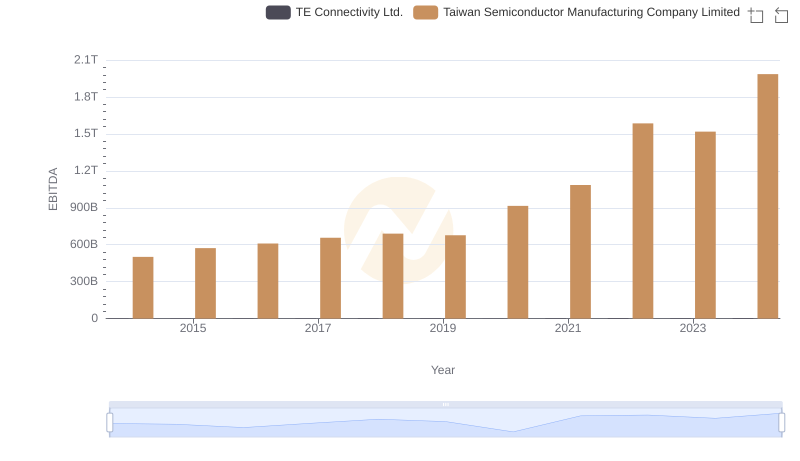
Taiwan Semiconductor Manufacturing Company Limited and TE Connectivity Ltd.: A Detailed Examination of EBITDA Performance
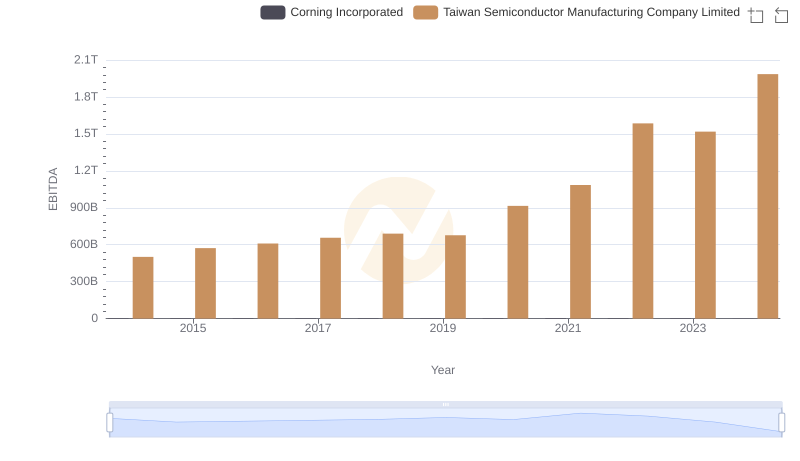
EBITDA Performance Review: Taiwan Semiconductor Manufacturing Company Limited vs Corning Incorporated
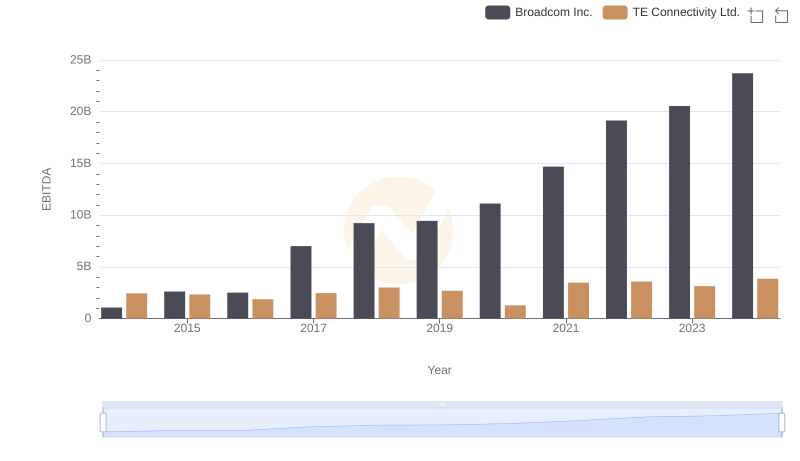
A Professional Review of EBITDA: Broadcom Inc. Compared to TE Connectivity Ltd.
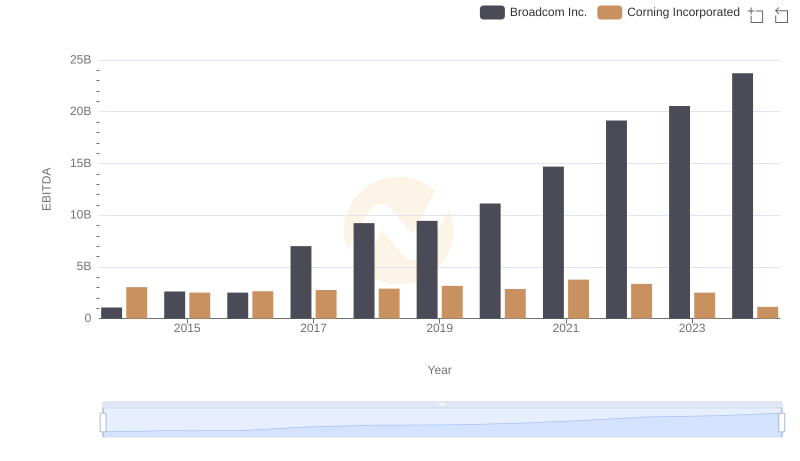
EBITDA Analysis: Evaluating Broadcom Inc. Against Corning Incorporated
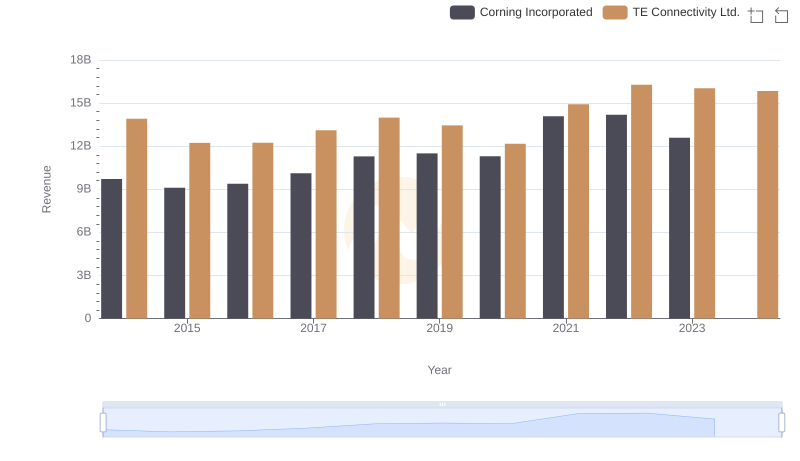
Revenue Insights: TE Connectivity Ltd. and Corning Incorporated Performance Compared
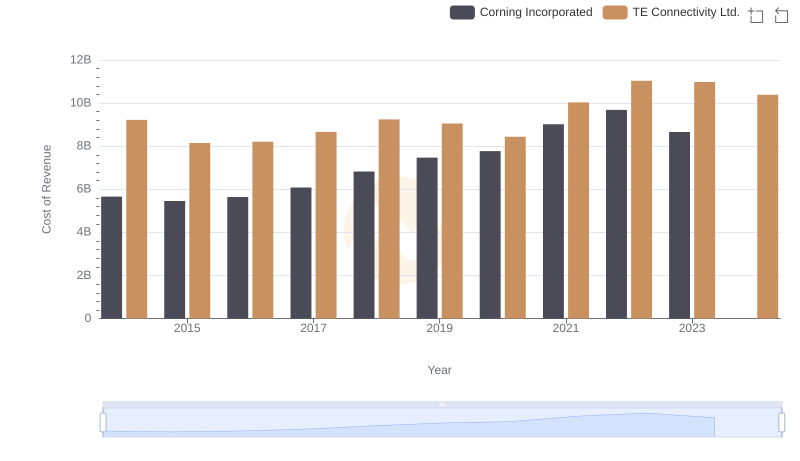
TE Connectivity Ltd. vs Corning Incorporated: Efficiency in Cost of Revenue Explored
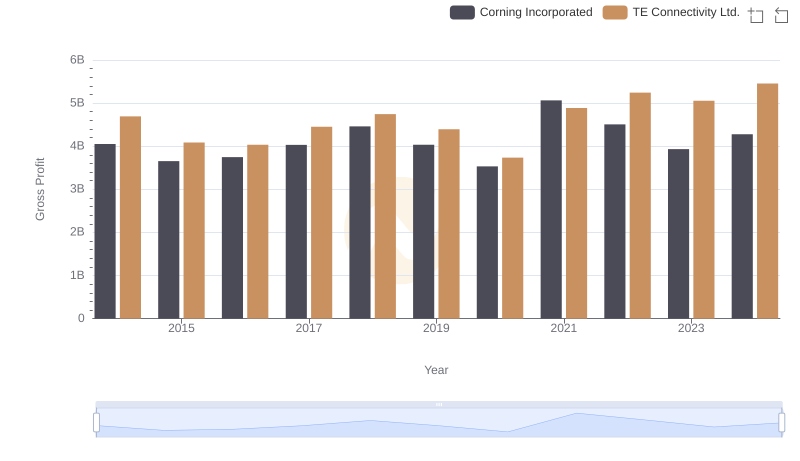
TE Connectivity Ltd. and Corning Incorporated: A Detailed Gross Profit Analysis
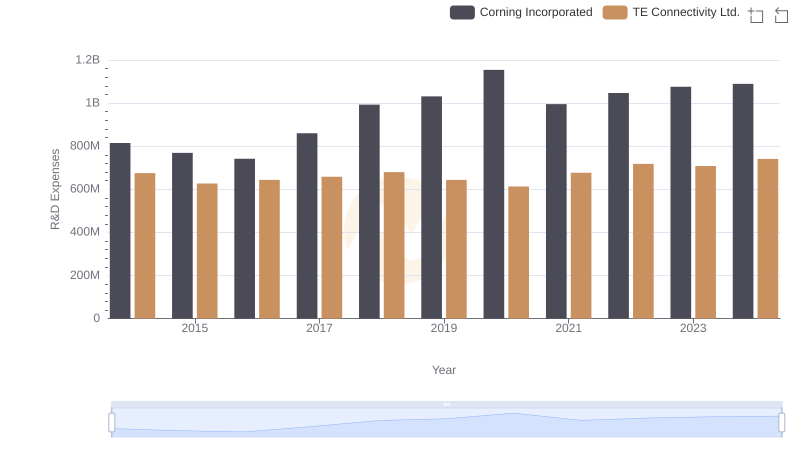
R&D Insights: How TE Connectivity Ltd. and Corning Incorporated Allocate Funds
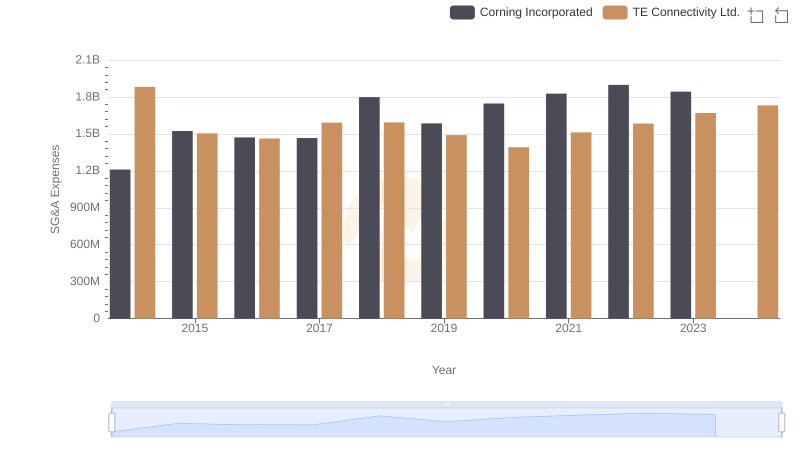
Cost Management Insights: SG&A Expenses for TE Connectivity Ltd. and Corning Incorporated