| __timestamp | Allegion plc | W.W. Grainger, Inc. |
|---|---|---|
| Wednesday, January 1, 2014 | 527400000 | 2967125000 |
| Thursday, January 1, 2015 | 510500000 | 2931108000 |
| Friday, January 1, 2016 | 559800000 | 2995060000 |
| Sunday, January 1, 2017 | 582500000 | 3048895000 |
| Monday, January 1, 2018 | 647500000 | 3190000000 |
| Tuesday, January 1, 2019 | 687200000 | 3135000000 |
| Wednesday, January 1, 2020 | 635700000 | 3219000000 |
| Friday, January 1, 2021 | 674700000 | 3173000000 |
| Saturday, January 1, 2022 | 736000000 | 3634000000 |
| Sunday, January 1, 2023 | 865600000 | 3931000000 |
| Monday, January 1, 2024 | 887800000 | 4121000000 |
Unleashing insights
In the competitive landscape of industrial supply and security solutions, W.W. Grainger, Inc. and Allegion plc have showcased distinct strategies in managing their Selling, General, and Administrative (SG&A) expenses over the past decade. From 2014 to 2023, W.W. Grainger, Inc. consistently maintained higher SG&A expenses, peaking at approximately $3.93 billion in 2023, reflecting a strategic investment in operational efficiency and market expansion. In contrast, Allegion plc, with a more conservative approach, saw its SG&A expenses grow from around $527 million in 2014 to $866 million in 2023, marking a 64% increase. This divergence highlights the varying approaches to cost management and growth strategies. As businesses navigate the post-pandemic economy, understanding these trends offers valuable insights into corporate resilience and adaptability.
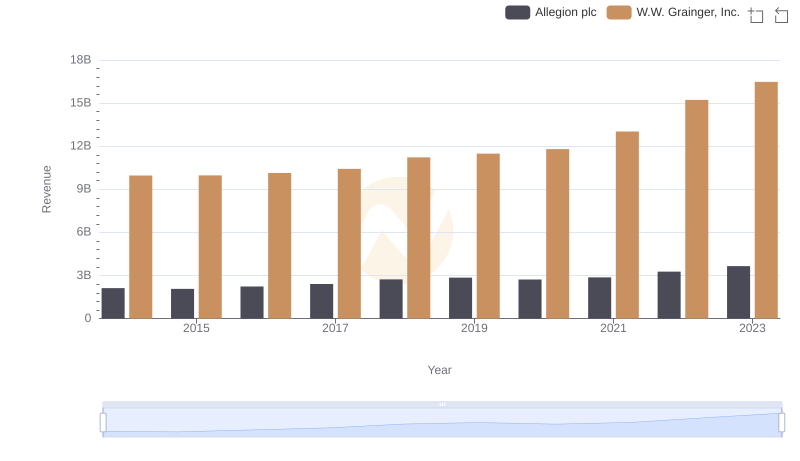
W.W. Grainger, Inc. vs Allegion plc: Examining Key Revenue Metrics
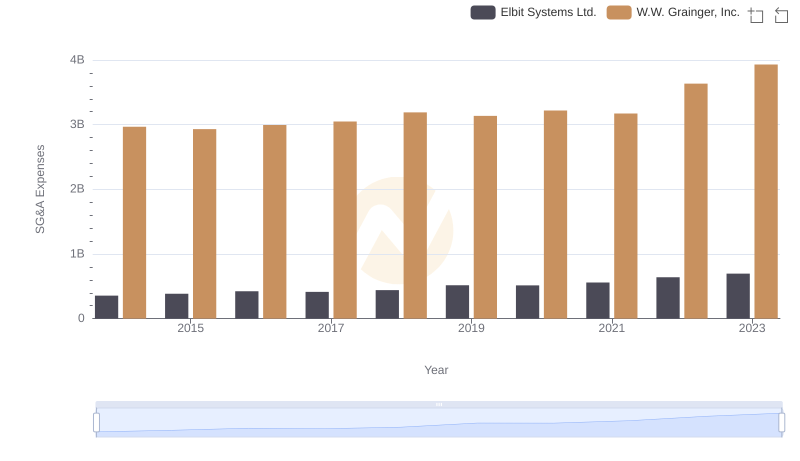
Operational Costs Compared: SG&A Analysis of W.W. Grainger, Inc. and Elbit Systems Ltd.
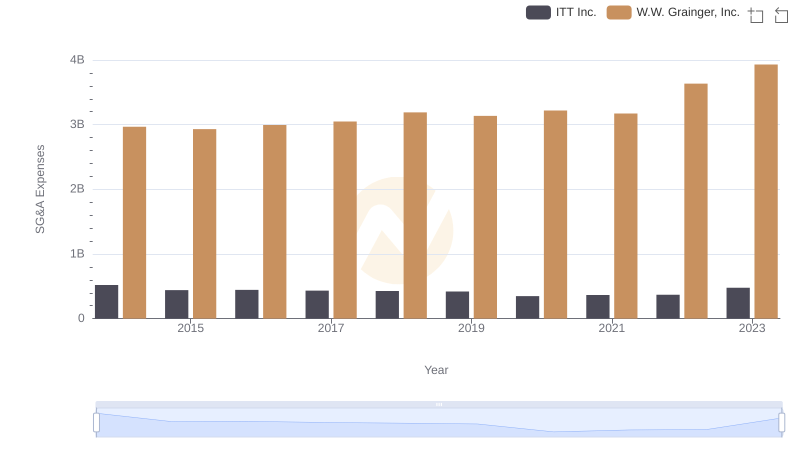
W.W. Grainger, Inc. and ITT Inc.: SG&A Spending Patterns Compared
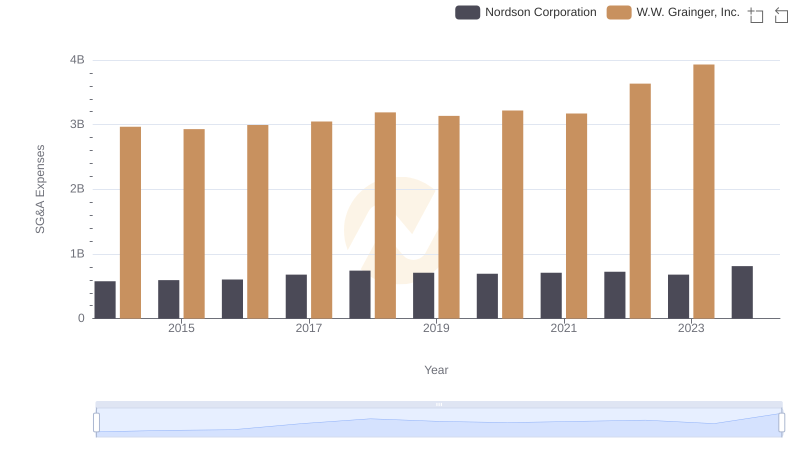
Who Optimizes SG&A Costs Better? W.W. Grainger, Inc. or Nordson Corporation
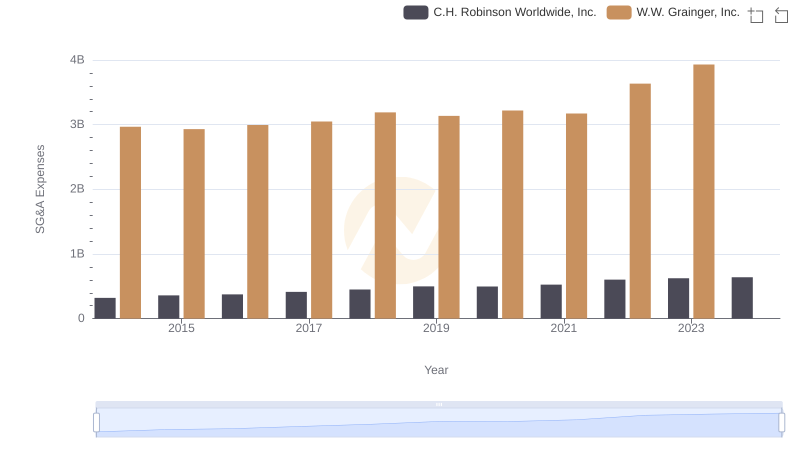
Who Optimizes SG&A Costs Better? W.W. Grainger, Inc. or C.H. Robinson Worldwide, Inc.
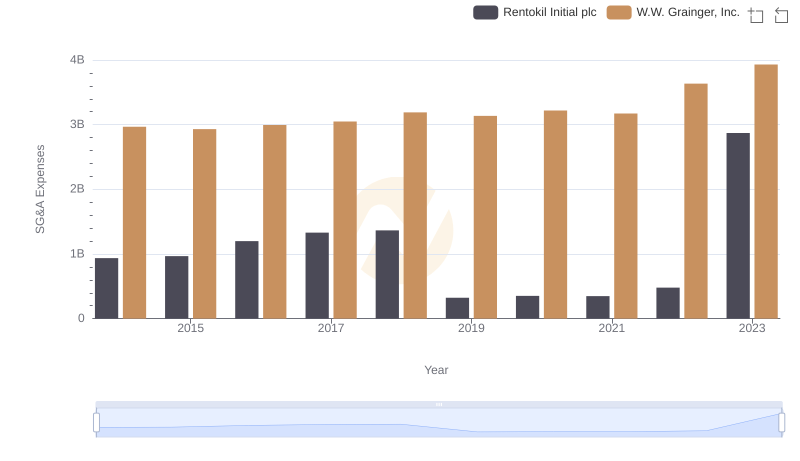
SG&A Efficiency Analysis: Comparing W.W. Grainger, Inc. and Rentokil Initial plc
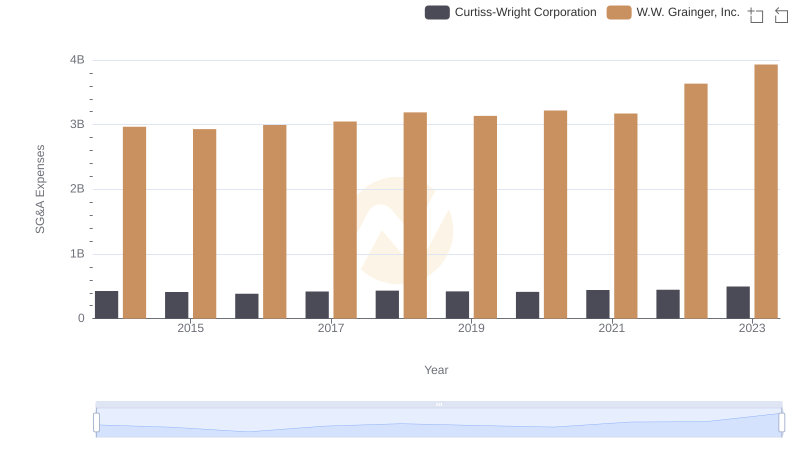
W.W. Grainger, Inc. vs Curtiss-Wright Corporation: SG&A Expense Trends
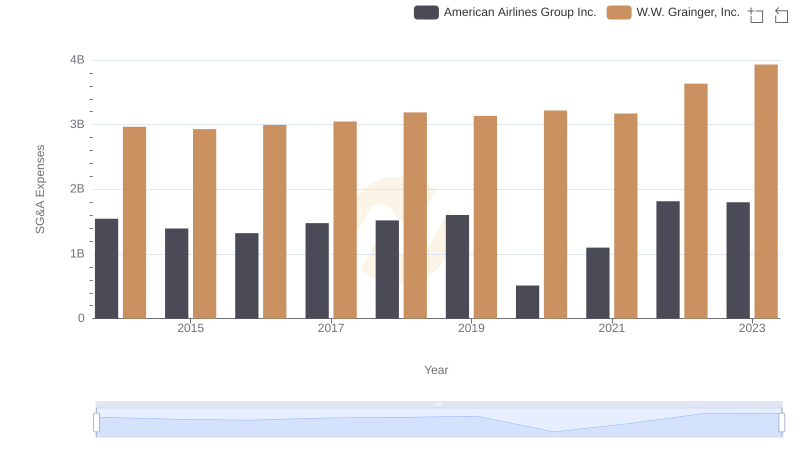
W.W. Grainger, Inc. or American Airlines Group Inc.: Who Manages SG&A Costs Better?
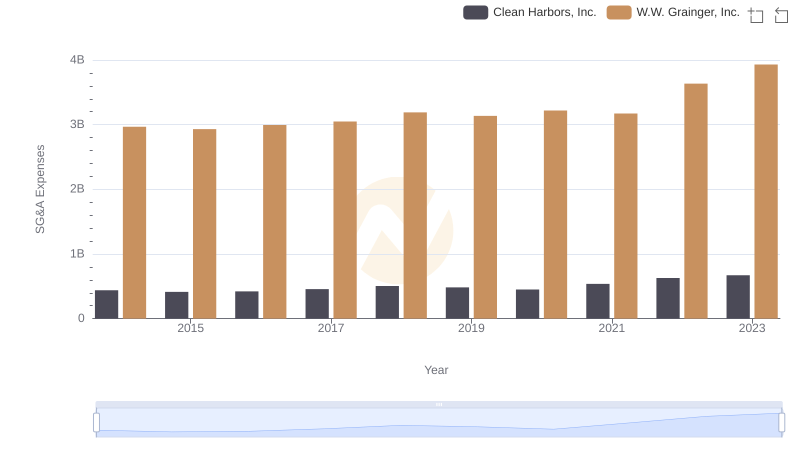
W.W. Grainger, Inc. or Clean Harbors, Inc.: Who Manages SG&A Costs Better?
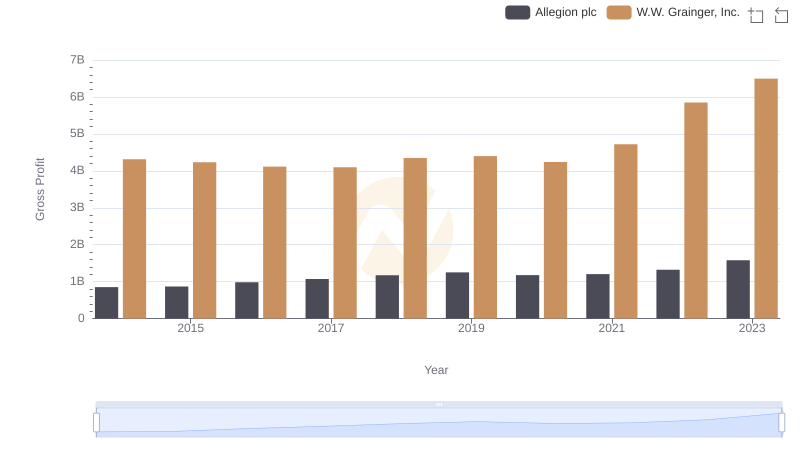
Key Insights on Gross Profit: W.W. Grainger, Inc. vs Allegion plc
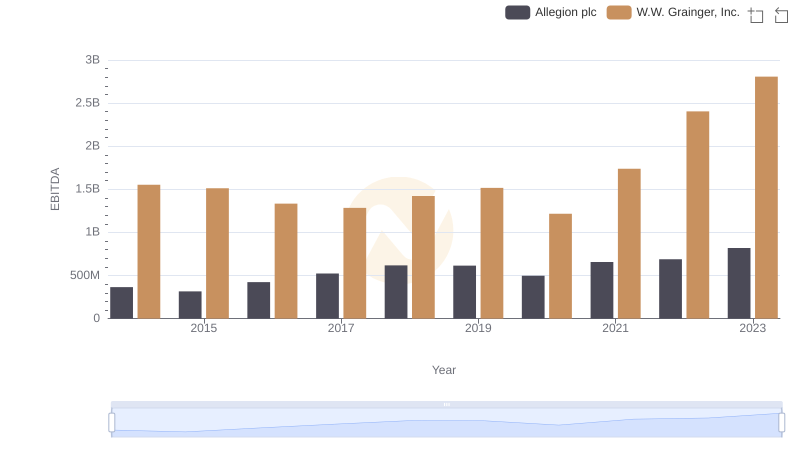
EBITDA Analysis: Evaluating W.W. Grainger, Inc. Against Allegion plc