| __timestamp | Allegion plc | W.W. Grainger, Inc. |
|---|---|---|
| Wednesday, January 1, 2014 | 365700000 | 1552805000 |
| Thursday, January 1, 2015 | 315400000 | 1512243000 |
| Friday, January 1, 2016 | 422600000 | 1334247000 |
| Sunday, January 1, 2017 | 523300000 | 1284000000 |
| Monday, January 1, 2018 | 617600000 | 1423000000 |
| Tuesday, January 1, 2019 | 614300000 | 1516000000 |
| Wednesday, January 1, 2020 | 497700000 | 1216000000 |
| Friday, January 1, 2021 | 657300000 | 1738000000 |
| Saturday, January 1, 2022 | 688300000 | 2404000000 |
| Sunday, January 1, 2023 | 819300000 | 2807000000 |
| Monday, January 1, 2024 | 919800000 | 2637000000 |
Infusing magic into the data realm
In the ever-evolving landscape of industrial supply and security solutions, W.W. Grainger, Inc. and Allegion plc stand as prominent players. Over the past decade, from 2014 to 2023, these companies have showcased distinct trajectories in their EBITDA performance. W.W. Grainger, Inc. has consistently outperformed Allegion plc, with its EBITDA peaking at approximately 2.8 billion in 2023, marking an impressive growth of around 80% from 2014. In contrast, Allegion plc, while showing a steady increase, reached its highest EBITDA of about 819 million in 2023, reflecting a growth of over 120% since 2014. This divergence highlights Grainger's robust market position and operational efficiency, while Allegion's growth underscores its strategic expansion in the security sector. As the industrial landscape continues to shift, these trends offer valuable insights into the strategic directions and market dynamics of these industry leaders.
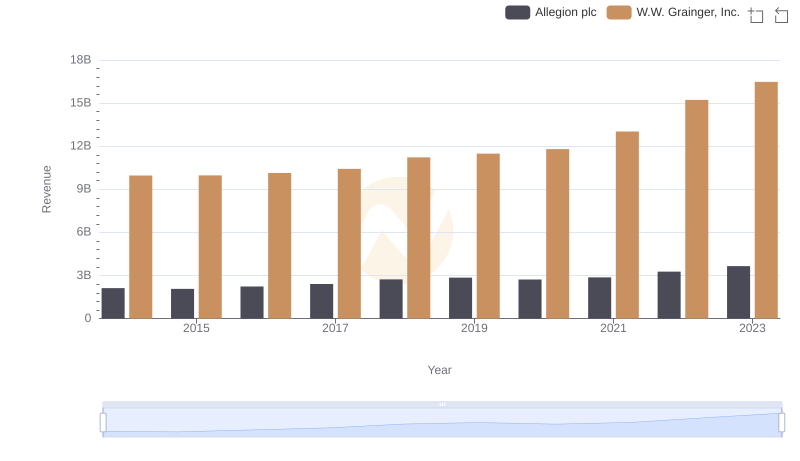
W.W. Grainger, Inc. vs Allegion plc: Examining Key Revenue Metrics

W.W. Grainger, Inc. vs Elbit Systems Ltd.: In-Depth EBITDA Performance Comparison
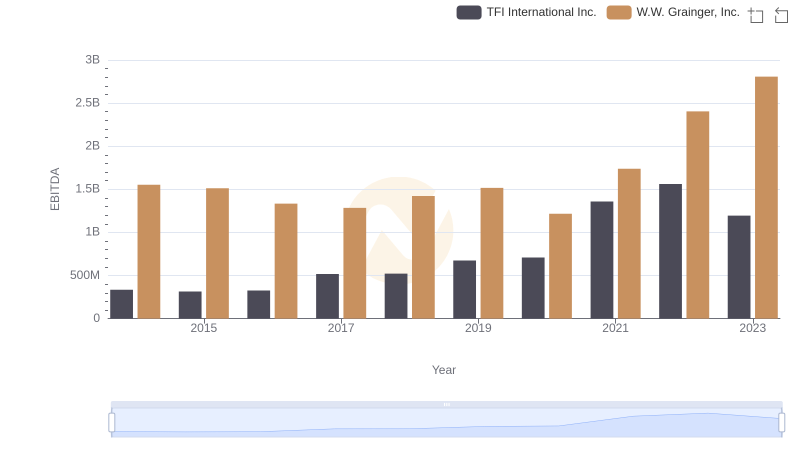
EBITDA Analysis: Evaluating W.W. Grainger, Inc. Against TFI International Inc.

A Professional Review of EBITDA: W.W. Grainger, Inc. Compared to ITT Inc.
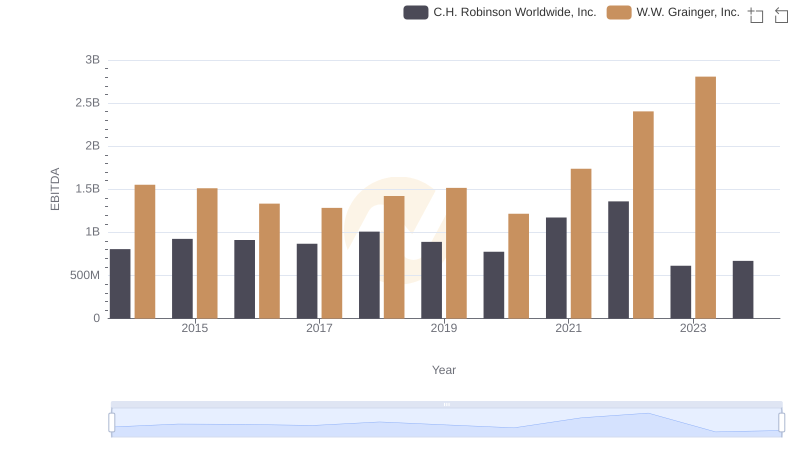
W.W. Grainger, Inc. vs C.H. Robinson Worldwide, Inc.: In-Depth EBITDA Performance Comparison
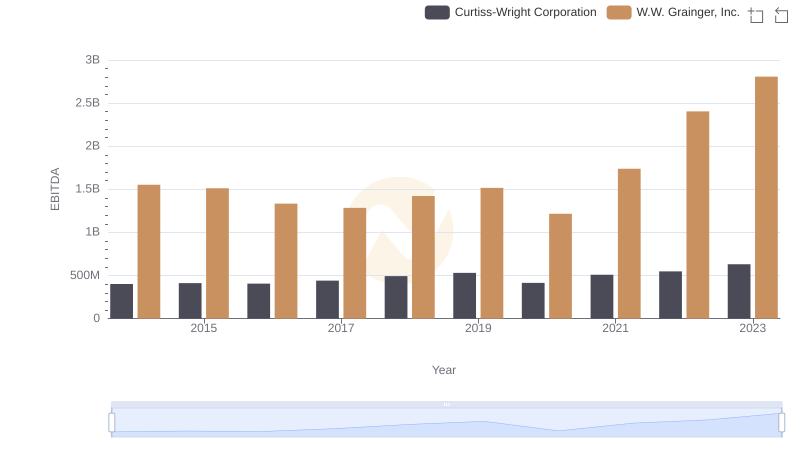
Comparative EBITDA Analysis: W.W. Grainger, Inc. vs Curtiss-Wright Corporation
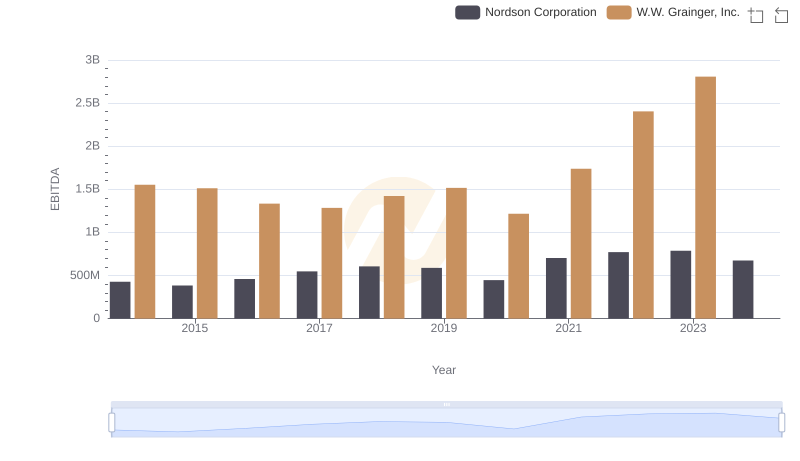
A Side-by-Side Analysis of EBITDA: W.W. Grainger, Inc. and Nordson Corporation
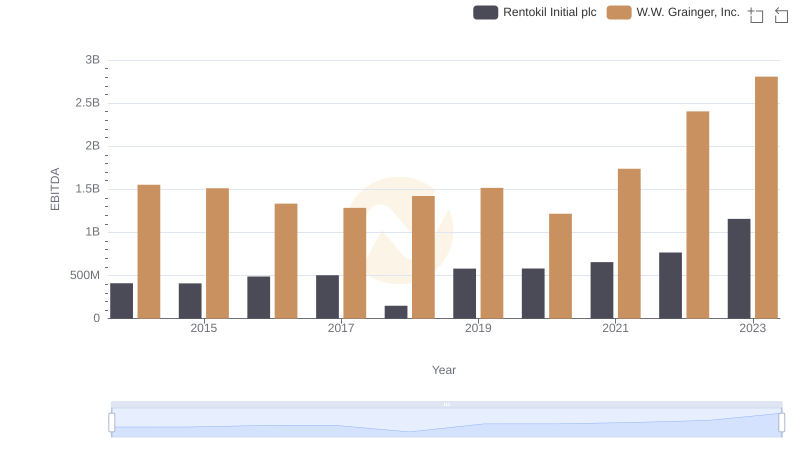
EBITDA Performance Review: W.W. Grainger, Inc. vs Rentokil Initial plc
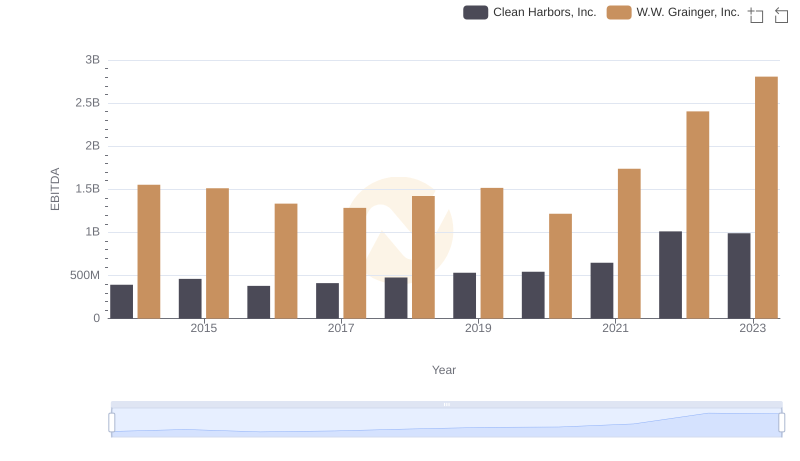
EBITDA Analysis: Evaluating W.W. Grainger, Inc. Against Clean Harbors, Inc.
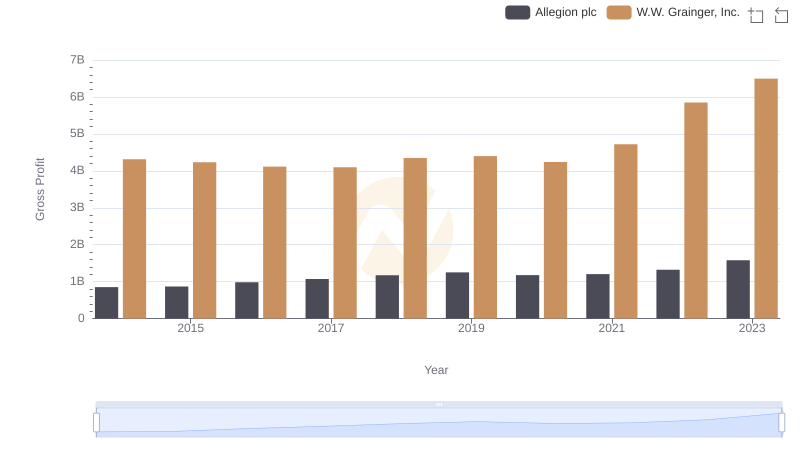
Key Insights on Gross Profit: W.W. Grainger, Inc. vs Allegion plc
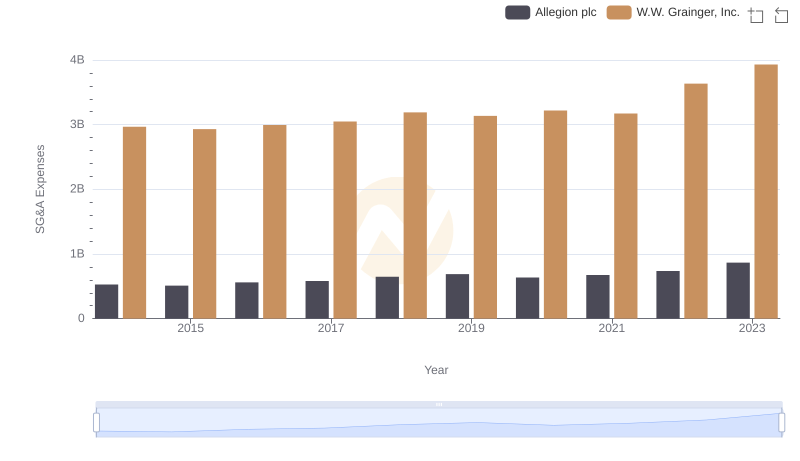
SG&A Efficiency Analysis: Comparing W.W. Grainger, Inc. and Allegion plc