| __timestamp | Allegion plc | Trane Technologies plc |
|---|---|---|
| Wednesday, January 1, 2014 | 527400000 | 2503900000 |
| Thursday, January 1, 2015 | 510500000 | 2541100000 |
| Friday, January 1, 2016 | 559800000 | 2606500000 |
| Sunday, January 1, 2017 | 582500000 | 2720700000 |
| Monday, January 1, 2018 | 647500000 | 2903200000 |
| Tuesday, January 1, 2019 | 687200000 | 3129800000 |
| Wednesday, January 1, 2020 | 635700000 | 2270600000 |
| Friday, January 1, 2021 | 674700000 | 2446300000 |
| Saturday, January 1, 2022 | 736000000 | 2545900000 |
| Sunday, January 1, 2023 | 865600000 | 2963200000 |
| Monday, January 1, 2024 | 887800000 | 3580400000 |
Unlocking the unknown
In the competitive landscape of industrial technology, understanding the efficiency of Selling, General, and Administrative (SG&A) expenses is crucial. Trane Technologies plc and Allegion plc, two industry leaders, have shown distinct trends over the past decade. From 2014 to 2023, Trane Technologies consistently maintained higher SG&A expenses, peaking in 2019 with a 25% increase from 2014. Meanwhile, Allegion plc exhibited a steady rise, culminating in a 64% increase by 2023. This divergence highlights Trane's expansive operational scale compared to Allegion's more conservative growth. The data suggests that while Trane invests heavily in administrative functions, Allegion's strategy leans towards streamlined operations. As the industrial sector evolves, these insights into SG&A efficiency could inform strategic decisions for stakeholders aiming to optimize operational costs.
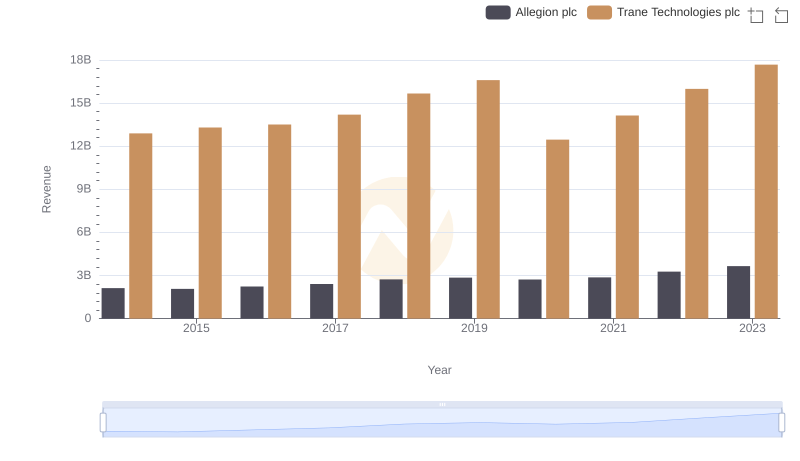
Breaking Down Revenue Trends: Trane Technologies plc vs Allegion plc
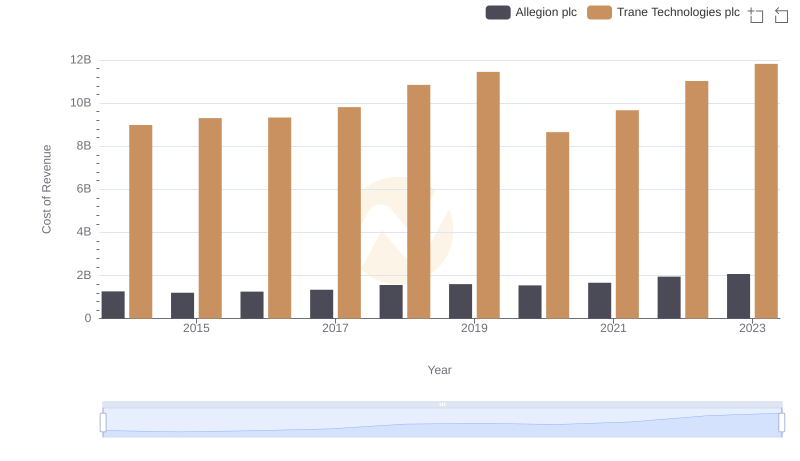
Cost of Revenue: Key Insights for Trane Technologies plc and Allegion plc
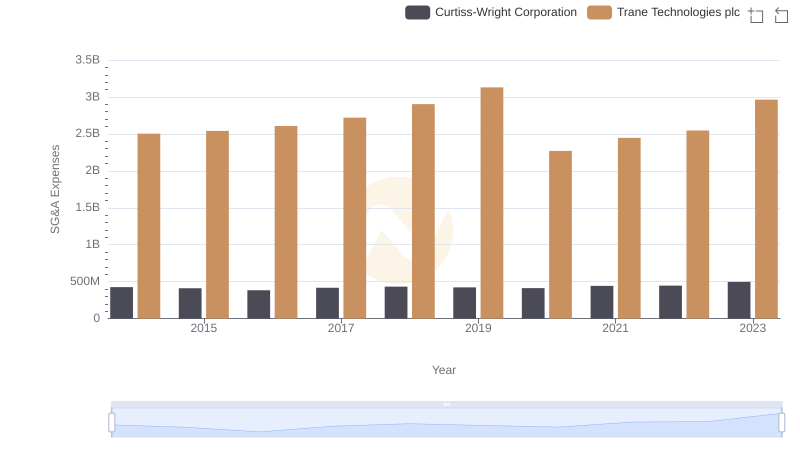
Trane Technologies plc vs Curtiss-Wright Corporation: SG&A Expense Trends
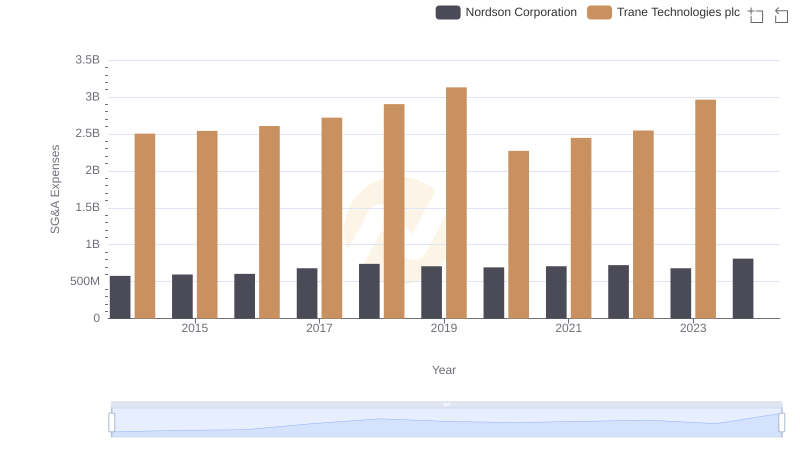
Trane Technologies plc or Nordson Corporation: Who Manages SG&A Costs Better?
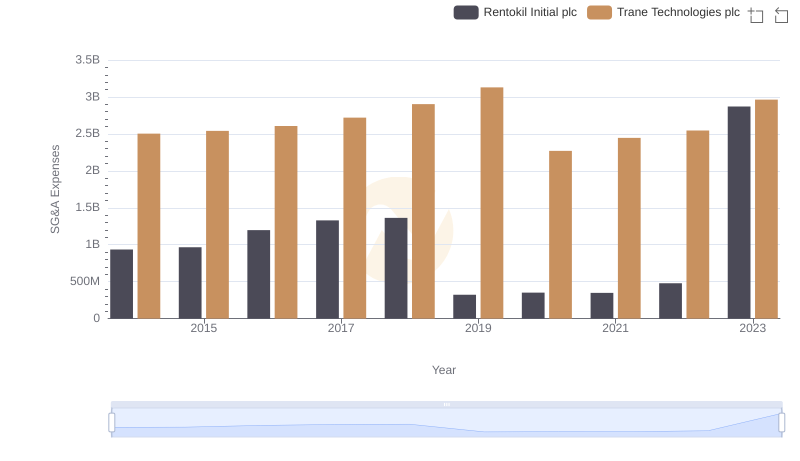
Cost Management Insights: SG&A Expenses for Trane Technologies plc and Rentokil Initial plc
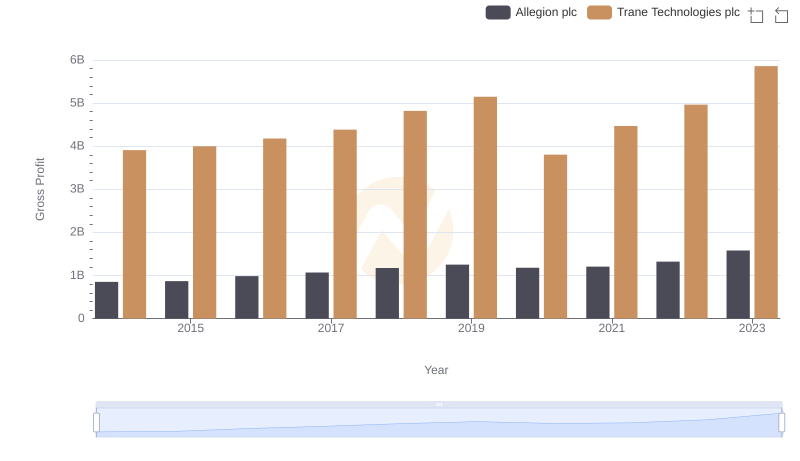
Gross Profit Analysis: Comparing Trane Technologies plc and Allegion plc
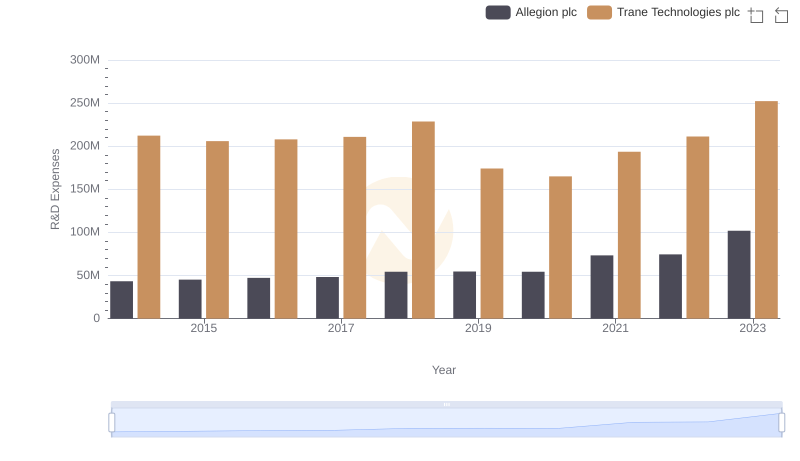
Research and Development: Comparing Key Metrics for Trane Technologies plc and Allegion plc
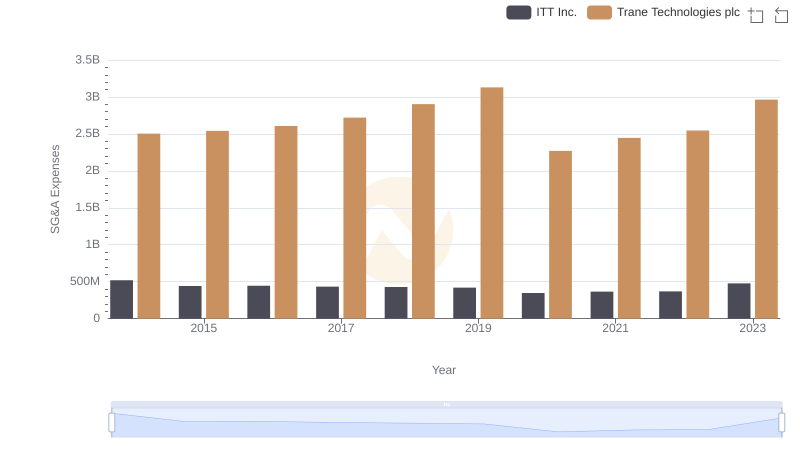
SG&A Efficiency Analysis: Comparing Trane Technologies plc and ITT Inc.
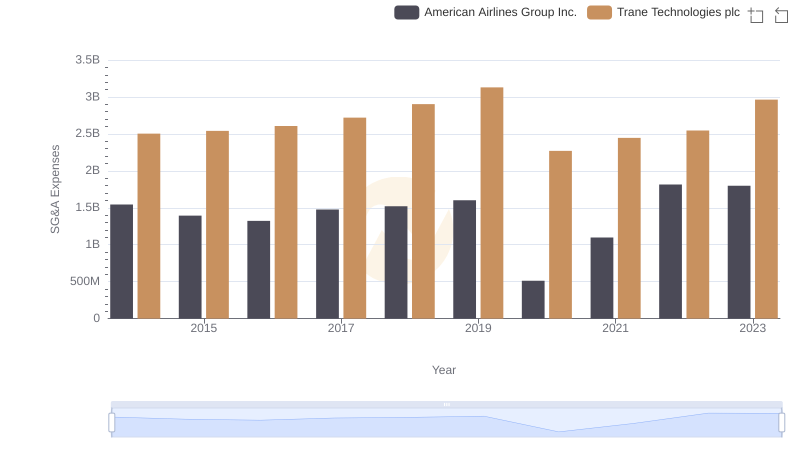
Selling, General, and Administrative Costs: Trane Technologies plc vs American Airlines Group Inc.